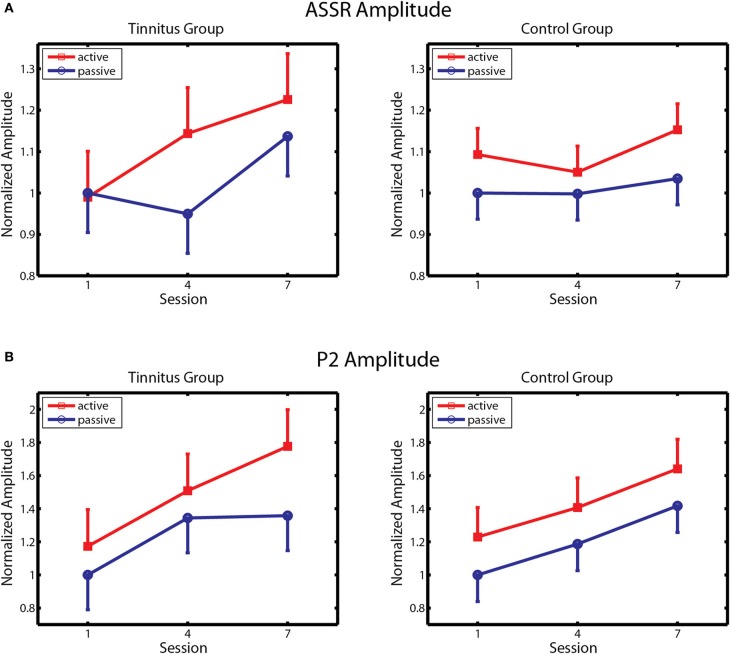
Figure 5.
ASSR amplitude and P2 amplitude. (A) Changes in ASSR amplitude over training in the Tinnitus (left panel) and Control (right panel) groups, on active and passive blocks. (B) Changes in P2 amplitude are similarly depicted. Response amplitude is normalized within each group to amplitude on passive blocks of the first session. Bars denote 1 within-subject standard error.

