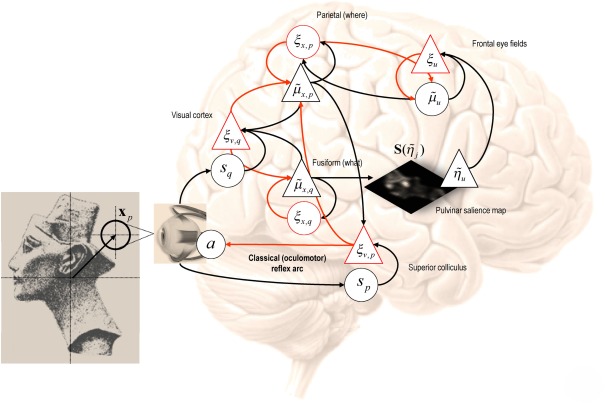
Figure 4.
This schematic depicts a particular instance of the message passing scheme in Figure 2. This example follows from the generative model of visual input described in the main text. The model prescribes a particular hierarchical form for generalized predictive coding; shown here in terms of state and error units (black and red respectively) that have been assigned to different cortical or subcortical regions. The insert on the left shows a visual scene (a picture of Nefertiti) that can be sampled locally by foveating a particular point – the true hidden state of the world. The resulting visual input arrives in primary visual cortex to elicit prediction errors that are passed forward to what and where streams. State units in the “what” stream respond by adjusting their representations to provide better predictions based upon a discrete number of internal images or hypotheses. Crucially, the predictions of visual input depend upon posterior beliefs about the direction of gaze encoded by state units in the “where” stream. These conditional expectations are themselves informed by top-down prior beliefs about the direction of gaze that maximizes salience. The salience map shown in the center is updated between saccades based upon posterior beliefs about the content of the visual scene. Posterior beliefs about the content of the visual scene provide predictions of visual input and future hidden states subtending salience. Posterior beliefs about the direction of gaze are used to form predictions of visual input and provide proprioceptive predictions to the oculomotor system in the superior colliculus and pontine nuclei, to elaborate a proprioceptive prediction error. This prediction error drives the oculomotor system to fulfill posterior beliefs about where to look next. This can be regarded as an instance of the classical reflects arc, whose set point is determined by top-down proprioceptive predictions. The variables associated with each region are described in detail in the text, while the arrows connecting regions adopt same format as in Figure 2 (forward prediction error afferents in red and backward predictions in black).

