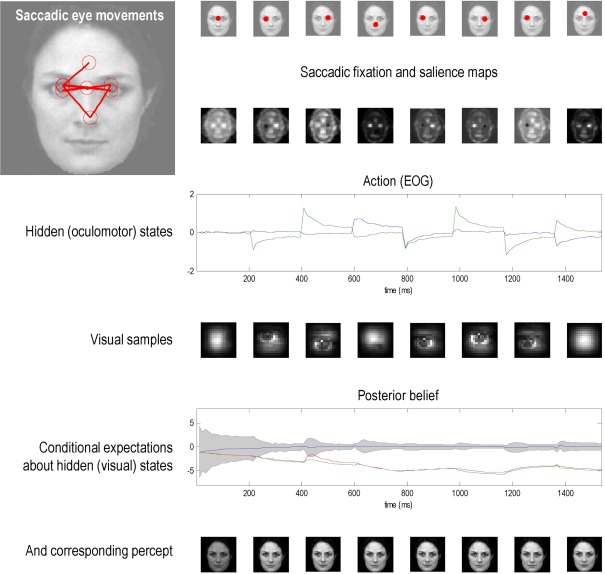
Figure 5.
This figure shows the results of the first simulation, in which a face was presented to an agent, whose responses were simulated using the optimal inference scheme described in the main text. In this simulation, the agent had three internal images or hypotheses about the stimuli it might sample (an upright face, an inverted face, and a rotated face). The agent was presented with an upright face and its conditional expectations were evaluated over 16 (12 ms) time bins until the next saccade was emitted. This was repeated for eight saccades. The ensuing eye movements are shown as red dots at the location (in extrinsic coordinates) at the end of each saccade in the upper row. The corresponding sequence of eye movements is shown in the insert on the upper left, where the red circles correspond roughly to the proportion of the image sampled. These saccades are driven by prior beliefs about the direction of gaze based upon the saliency maps in the second row. Note that these maps change with successive saccades as posterior beliefs about the hidden states, including the stimulus, become progressively more confident. Note also that salience is depleted in locations that were foveated in the previous saccade. These posterior beliefs provide both visual and proprioceptive predictions that suppress visual prediction errors and drive eye movements respectively. Oculomotor responses are shown in the third row in terms of the two hidden oculomotor states corresponding to vertical and horizontal displacements. The associated portions of the image sampled (at the end of each saccade) are shown in the fourth row. The final two rows show the posterior beliefs in terms of their sufficient statistics and the stimulus categories respectively. The posterior beliefs are plotted here in terms of conditional expectations and the 90% confidence interval about the true stimulus. The key thing to note here is that the expectation about the true stimulus supervenes over its competing expectations and, as a result, conditional confidence about the stimulus category increases (the confidence intervals shrink to the expectation). This illustrates the nature of evidence accumulation when selecting a hypothesis or percept that best explains sensory data. Within-saccade accumulation is evident even during the initial fixation with further stepwise decreases in uncertainty as salient information is sampled at successive saccades.

