
Figure 3.
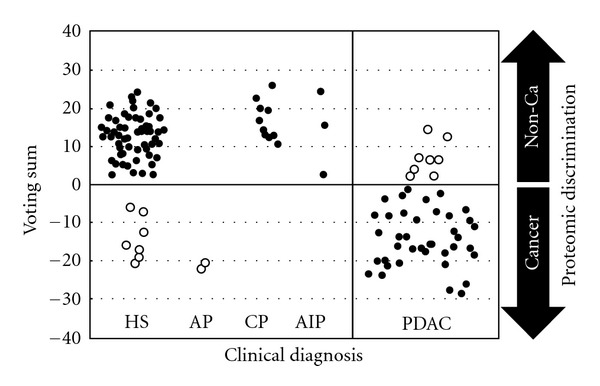
Assessment of 7-signal proteomic model with the validation cohort using weighted voting algorithm. The results of proteomic analyses of the training cohort are shown. Each circle represents a voting sum for a single patient. Solid circles: specimens whose prediction with proteomic model matched clinical diagnosis; open circles: specimens whose prediction with proteomic model did not match clinical diagnosis; HS: healthy subjects; AP: acute pancreatitis; CP: chronic pancreatitis; AIP: autoimmune pancreatitis; PDAC: pancreatic ductal adenocarcinoma.