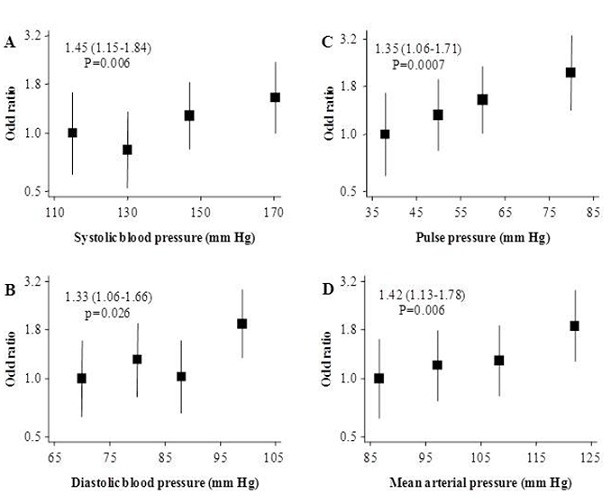
Figure 1.

Adjusted odd ratios and 95% confidence interval (95% CI) for the presence of nephropathy comparing the fourths for systolic (panel A), diastolic (panel B), pulse (panel C) and mean (panel D) arterial blood pressure. All analyses were adjusted by age, sex, use of blood pressure lowering medication and recruitment centres. Boxes are for the point estimates (odd ratios) and the vertical bars about represent the 95% confidence intervals. The size of the box is proportional to the inverse variance of the natural logarithm of the odd ratio, and boxes are plotted against the median specific to each fourth of blood pressure variable on the horizontal axis. The vertical axis is on log-scale to allow a balanced distribution of the 95% CI about the effect estimates, and a better visualisation of the trends of the associations.
