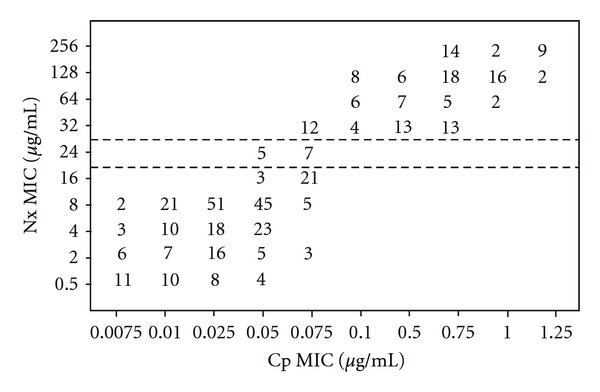
Figure 1.

Scattergram for 421 S. Typhi isolates correlating the minimum inhibitory concentration (MIC) values of nalidixic acid (Nx) to the MICs of ciprofloxacin (Cp). The broken horizontal lines represent the NCCLS breakpoint recommendations for susceptibility (MIC, ≤16 μg/mL) and resistance (MIC, ≥32 μg/mL) to Nx. The numbers within the graphic indicate the number of S. Typhi isolates.
