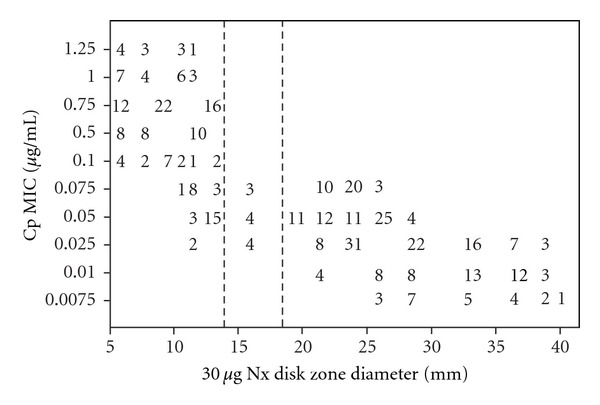
Figure 2.

Scattergram plotting the minimum inhibitory concentration (MIC) values of ciprofloxacin (Cp) and zone diameter of inhibition (ZDI) around 30 μg nalidixic acid (Nx) disc for 421 S. Typhi isolates processed by the NCCLS methods. The broken vertical lines represent interpretative ZDI suggested for Enterobacteriaceae (susceptible at ≥19 mm, resistant at ≤13 mm). The numbers within the graphic indicate the number of S. Typhi isolates.
