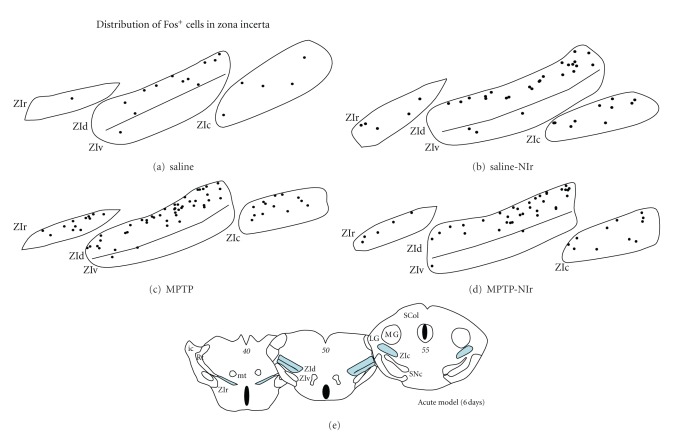
Figure 5.
Schematic diagrams of the distribution of Fos+ cells in the different sectors of the STN in the saline (a), saline-NIr (b), MPTP (c) and MPTP-NIr groups. These maps are from the acute model with six-day survival period (similar patterns were evident in the chronic model; in the acute model with two-hour survival period, the distribution of cells was similar to the saline cases shown here). Each black circle represents one cell. These maps were taken from coronal sections similar to the plates of the mouse atlas (numbers in italics [1]) shown in (e).

