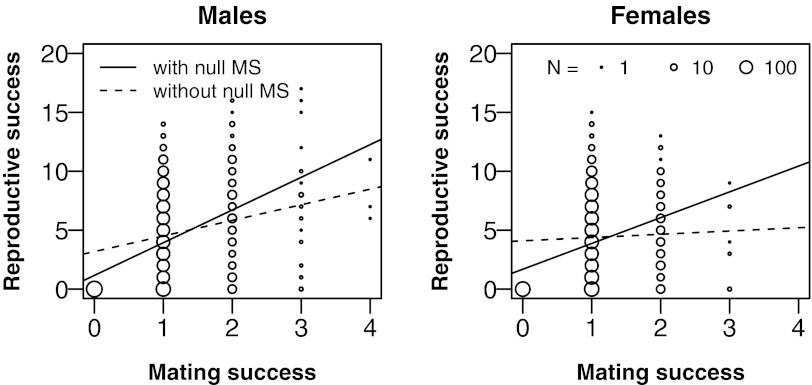
Fig. 3.
Relationship between number of marriages and number of children in males (Left) and females (Right). Lines represent regression lines including all individuals surviving to reproductive age (continuous line) or only those married at least once (dashed line). The diameters of circles are proportional to the logarithm of the number of individuals.

