Fig. 3.
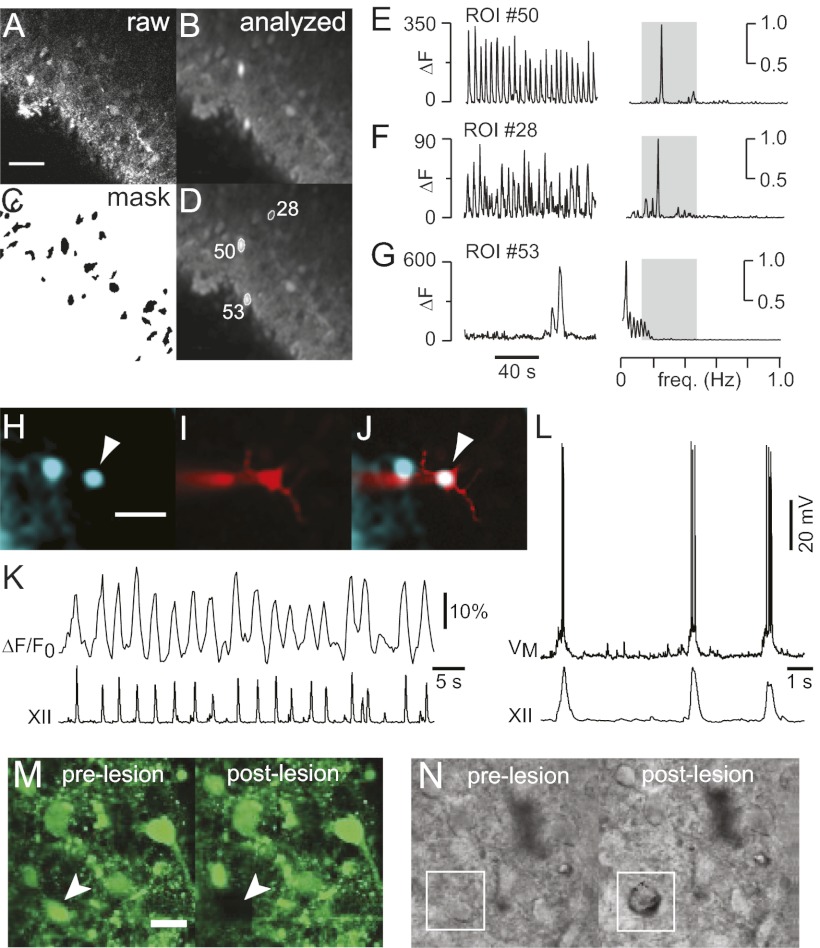
Neuron detection and ablation. (A) One frame of raw fluorescence. (B) SD of fluorescence through 2-min stack. (C) Mask of putative target cells. (D) Detected cells displayed with ROIs and numeric indices. (E–G) Time- and frequency-domain analyses. ΔF was plotted to emphasize differences in the amplitude of the fluorescence signals. (E) Inspiratory neuron (#50). (F) Inspiratory neuron (#28). (G) Nonrespiratory neuron (#53). (H) Inspiratory neuron (arrowhead) detected automatically by the software. Cyan-green pseudocolor shows SD of Fluo-8 AM activity. (I) Neuron in H filled with Alexa 568 from the patch pipette. (J) Merged image. (K) ΔF/F0 activity from the cell in H–J with XII output. (L) Whole-cell recording from the cell in H–K with XII output. (Scale bars: A and H: 40 μm.) (M) Pre- and postlesion images of Fluo-8 AM labeled neurons in the preBötC. Arrowhead shows the target cell. (N) Pre- and postlesion images in IR-DIC with the target cell outlined in white. (Scale bars: M and N, 20 μm.)

