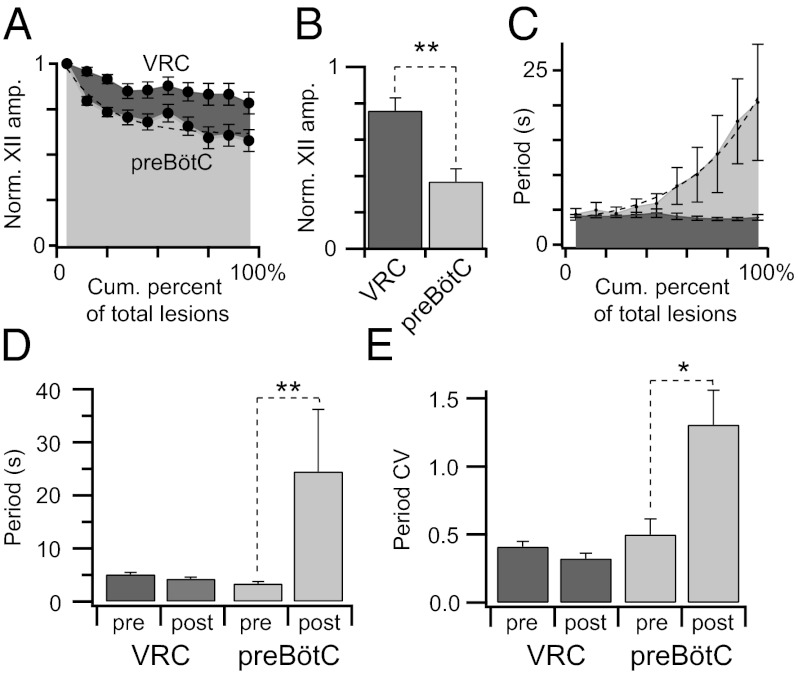
Fig. 5.
Ablation effects on respiratory rhythm and XII amplitude. Measurements are displayed in light gray for preBötC-surface slices and dark gray for VRC-surface slices. (A) XII amplitude vs. cumulative percent of total lesions. (B) Postlesion changes in XII amplitude (**P = 0.001). (C) Cycle periods vs. cumulative percent of total lesions. A dashed exponential function is fit to the cycle period data for preBötC-surface slices. (D) Mean cycle period for pre- and postlesion epochs, (**P = 0.008). (E) Mean CV for pre- and postlesion epochs (*P = 0.02).

