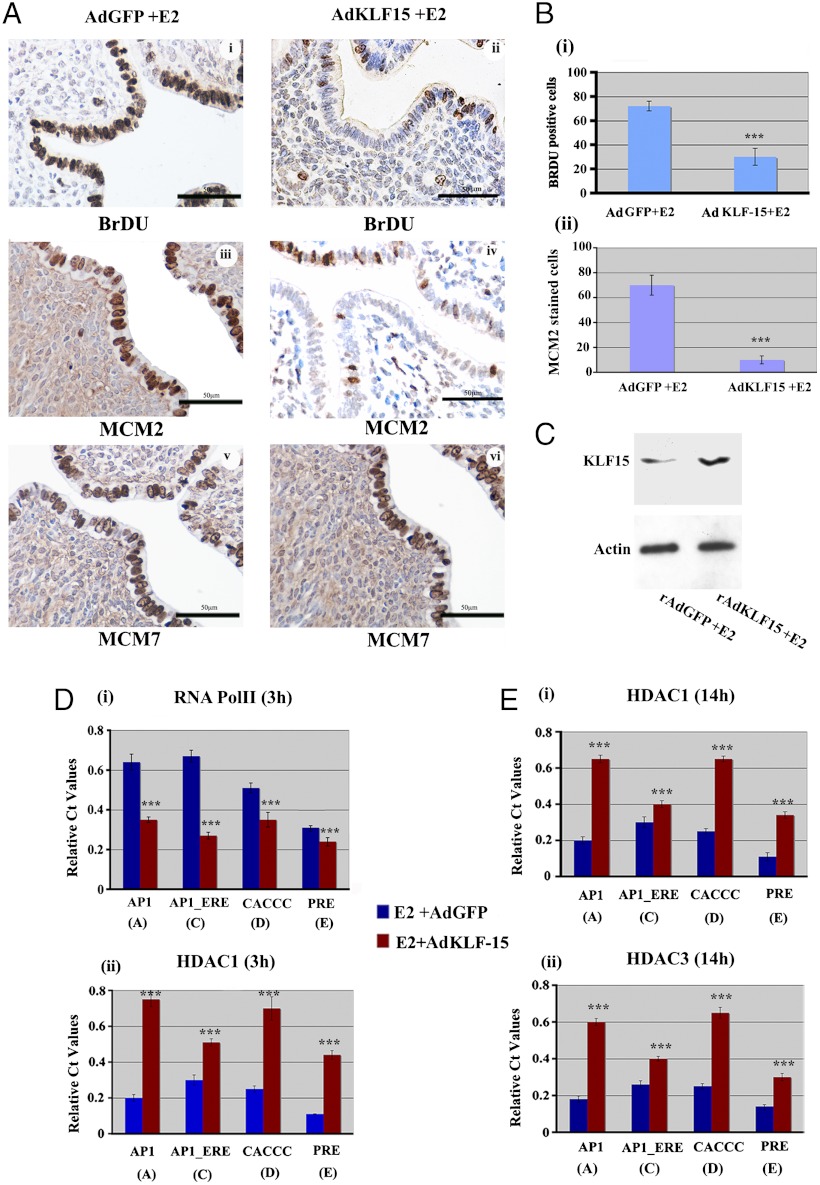
Fig. 7.
KLF15 expression in the mouse uterus suppresses MCM2 expression and inhibits E2-induced epithelial DNA synthesis. (A) Ovariectomized CD1 mice were exposed to rAdGFP (control) (i, iii, v) or rAdKLF15 (ii, iv, vi) as described in the Materials and Methods, followed by injection of E2 for 14 h. Two hours before killing, mice were given BrDU ip. (I and ii). Transverse sections of formalin fixed uteri were immunostained for (i, ii) BrDU incorporation, (iii and iv) MCM2 and (v and vi) MCM7 followed by hematoxylin staining as described. Brown staining indicates positive reactivity. The data described here are representative of the analysis of at least five different mice for each group. Scale bar: 50 um. (B) Differential BrDU incorporation (i) or MCM2 staining (ii). Percentage of positive epithelial cells staining for nuclear BrDU (i) or MCM2 (ii) in Ad-KLF-15 or Ad-GFP infected mice 14 h after E2 administration. ***P < 0.001, n = 5. (C) KLF15 protein expression after rAdKLF15 or rAdGFP treated uterus. Equivalent amount of protein lysate isolated from uterine epithelial cells of mice treated with rAdKLF15 (experiment) or rAdGFP (control) followed by E2 for 14 h were separated by SDS PAGE and subjected to Western blotting with specific antibodies as shown. Actin was used as a protein loading control. (D) Analysis of RNA Pol II and HDAC1 association on Mcm2 promoter after KLF15 overexpression. Uterine tissues were collected after administration of rAdKLF15 (experiment: red bars) or rAd-GFP (control: blue bars) as described in Materials and Methods followed by E2 treatment for 3 h. ChIP analysis on isolated chromatin was performed with antibody against RNA Pol II (i) and HDAC1 (ii) on the indicated regions of Mcm2 gene promoter. Data was analyzed by Student t test. Difference in binding in each position ***P < 0.001, n = 5. (E) Analysis of acetylation signature on Mcm2 promoter after AdKLF-15 overexpression. ChIP analysis was performed and data expressed as defined in Fig. 2 using chromatin isolated from uterine tissues after rAd-KLF-15 (red bars) or rAd-GFP (blue bars) infection followed by E2 treatment for 14 h with antibody against HDAC1 (i) or HDAC3 (ii). (Difference between binding ***P < 0.001, n = 5).

