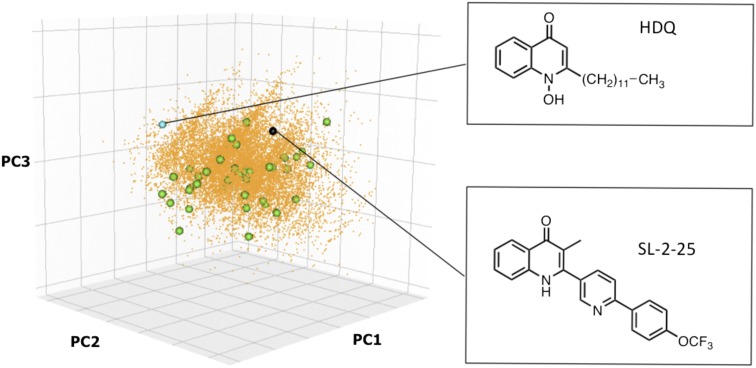
Fig. 1.
3D plot of chemical space showing progression from HDQ via hits from HTS to SL-2–25. Chemical space representation of first three principal components is based on calculated physiochemical properties of 48 hit compounds that account for 88.5% of the variance. All other compounds projected into principal component space using this model. The cyan sphere represents HDQ; orange points represent ∼17,000 compounds selected via chemoinformatics methods and screened in HTS; green spheres represent 48 hits from HTS; and the back sphere represents SL-2–25. The three-component principal components analysis model was built using Knime (http://www.knime.org), and the 3D plot was produced using R using the Ruby Graph Library (http://cran.r-project.org).

