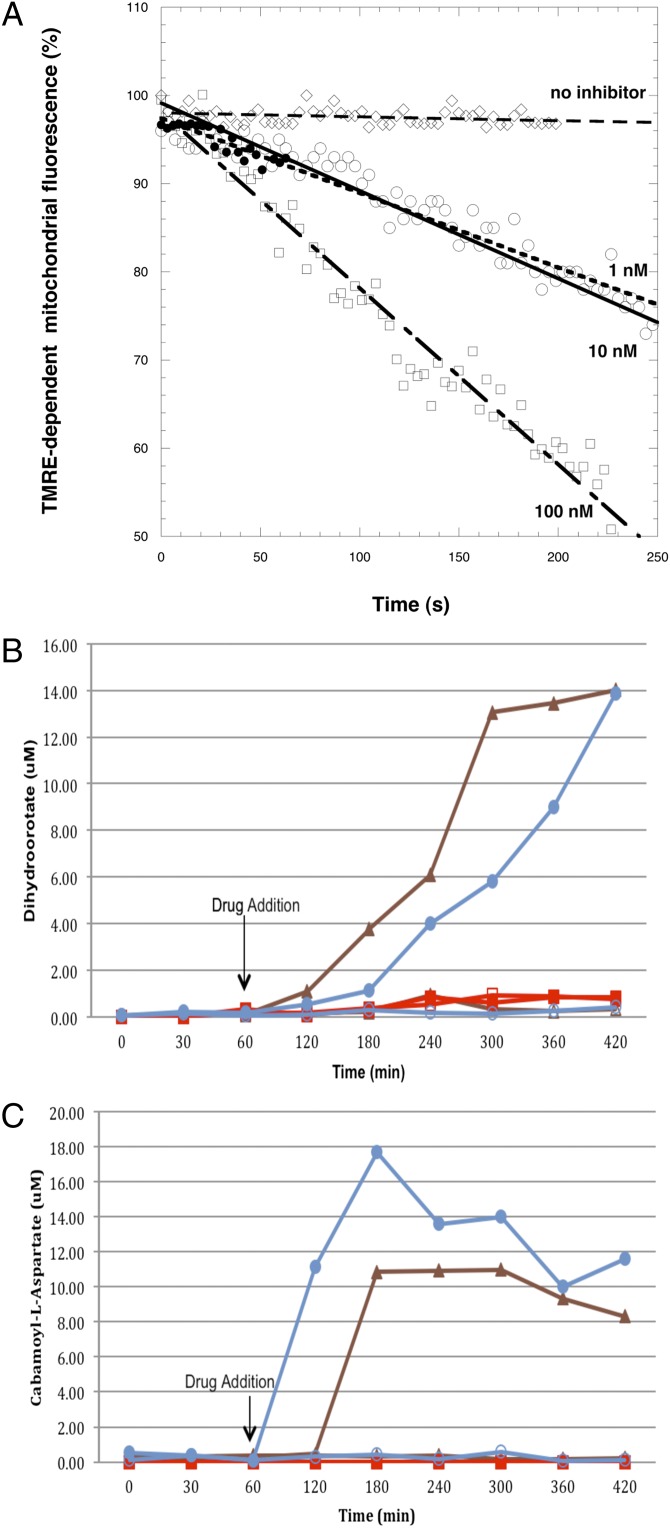
Fig. 4.
(A) Time course of tetramethylrhodamine ethyl ester-dependent mitochondrial fluorescence after the addition of CK-2–68 to P. falciparum-infected erythrocytes. Data were normalized to 100% in untreated cells and to 0% in cells treated with 10 μM carbonyl cyanide m-chlorophenyl hydrazone. ♢, Untreated cells; ○, 1 nM CK-2–68; ●, 10 nM CK-2–68; □, 100 nM CK-2–68. Graph shows data derived from experiments performed independently (n ≥ 3). (B) Dihydroorotate and (C) carbamoyl-l-aspartate concentrations in P. falciparum 3D7 and 3D7-yDHODH·GFP parasites following addition of 100 nM CK-26–8 and atovaquone. △, untreated 3D7 parasites; ▲, atovaquone-treated 3D7 parasites; □, untreated 3D7-yDHODH·GFP parasites; ■, atovaquone-treated 3D7-yDHODH·GFP parasites; ○, untreated 3D7 parasites; ●, CK-2–68–treated 3D7 parasites.

