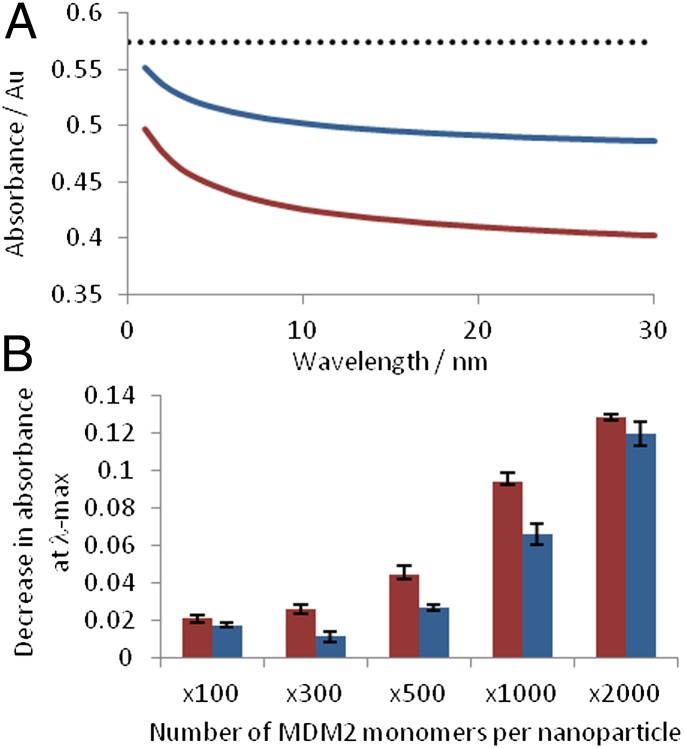
Fig. 3.
Extinction spectroscopy analysis of PSN aggregation. (A) Extinction spectroscopy monitored for a 30-min duration following MDM2 addition to PSN-12.1 (red) and PSN-12.1WΔA (blue) at a PSN:MDM2 molar ratio of 1:1,000. Dotted line indicates the average plasmon band intensity before MDM2 addition. (B) Change in the plasmon band monitored from the 1–30 min after MDM2 addition. Error bars illustrate the SD.

