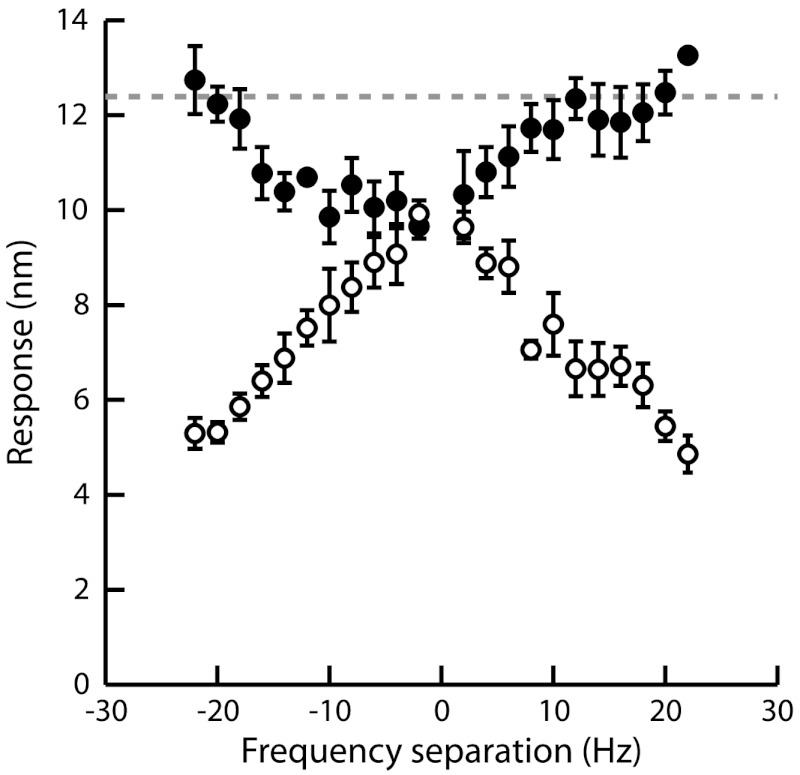
Fig. 2.
Frequency specificity of two-tone suppression. The two components of the stimulus had here the same amplitude F1 = F2 = 2 pN. The frequency f1 = 24 Hz of the test tone was fixed near the bundle’s characteristic frequency of oscillation fC = 23 Hz, while the frequency f2 of the masker tone was varied. The magnitude of bundle motion, at frequencies f1 (●) and f2 (○), is plotted as a function of the frequency separation Δf = f2 - f1. The dashed line represents the response level when the test tone was presented alone.

