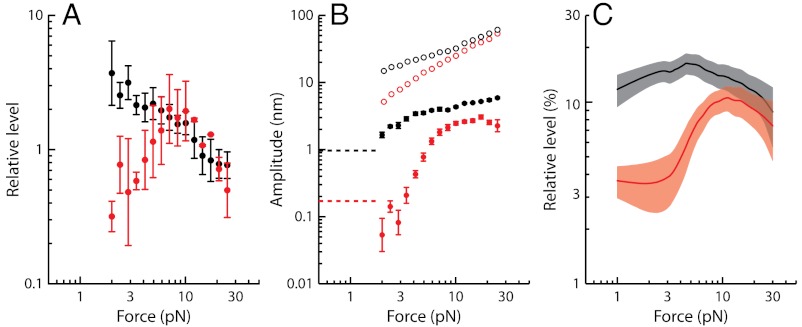
Fig. 4.
Level function of cubic difference products. (A) The level of the cubic-difference products at 2f1 - f2 and 2f2 - f1, for which we computed the arithmetic mean, is here compared to that of the quadratic-summation product f1 + f2. The ratio of these two quantities is plotted as a function of the magnitude  of the external force for stimulation at resonance (black) and off-resonance (red). (B) Arithmetic-mean level of the two cubic difference products 2f1 - f2 and 2f2 - f1 (filled circles) and of the two primaries f1 and f2 (open circles) at resonance (black) and off-resonance (red) as a function of the stimulus amplitude
  . Dashed horizontal lines mark noise-floor levels when distortion products first appeared. Data in A and B from the same dataset as that used to plot Fig. 3. (C) For n = 11 cells with f2/f1 = 1.08 - 1.15, the arithmetic-mean level of the two cubic difference products was divided by that of the primaries at resonance (black) and off-resonance (red). This relative level is plotted as a function of the stimulus amplitude
  . The continuous lines correspond to a moving average over a window comprising seven data points. The shaded areas represent 95% confidence intervals.

