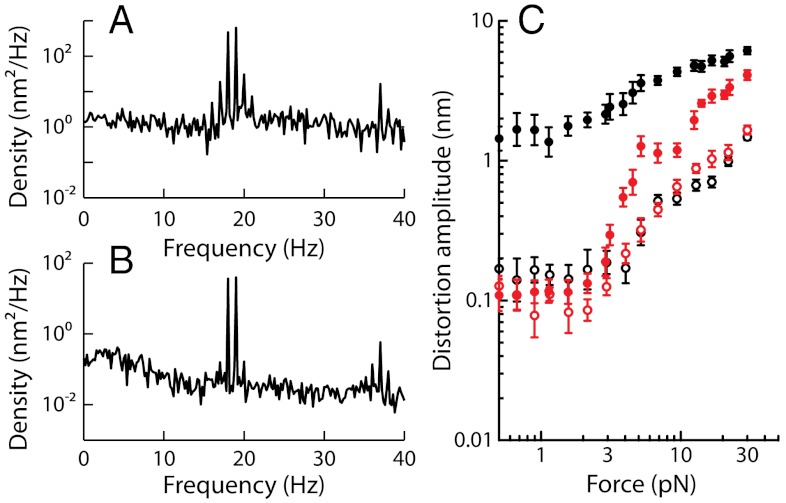
Fig. 6.
Effects of Ca2+ on cubic difference products. This hair bundle was subjected to the sum of two sinusoidal forces with equal amplitudes  . (A) At an endolymphatic Ca2+ concentration of 250 μM, the hair bundle displayed spontaneous oscillations at a characteristic frequency fC = 19 Hz. The spectral density of hair-bundle movement is plotted for stimulation at resonance (f1 = 18 Hz and f2 = 19 Hz) with a stimulus amplitude
  . (B) When the Ca2+ concentration was raised to a value of 1 mM, the hair bundle became quiescent. The spectral density of motion resulted from the same stimulus as in A. (C) The arithmetic-mean level of the two cubic difference products is plotted as a function of the stimulus amplitude
  for f1 = 18 Hz and f2 = 19 Hz (black) and f1 = 180 Hz and f2 = 190 Hz (red). Close and open symbols correspond to oscillatory and quiescent conditions, respectively. Note the notch in the level function depicted by red disks. Data in A–C from the same cell.

