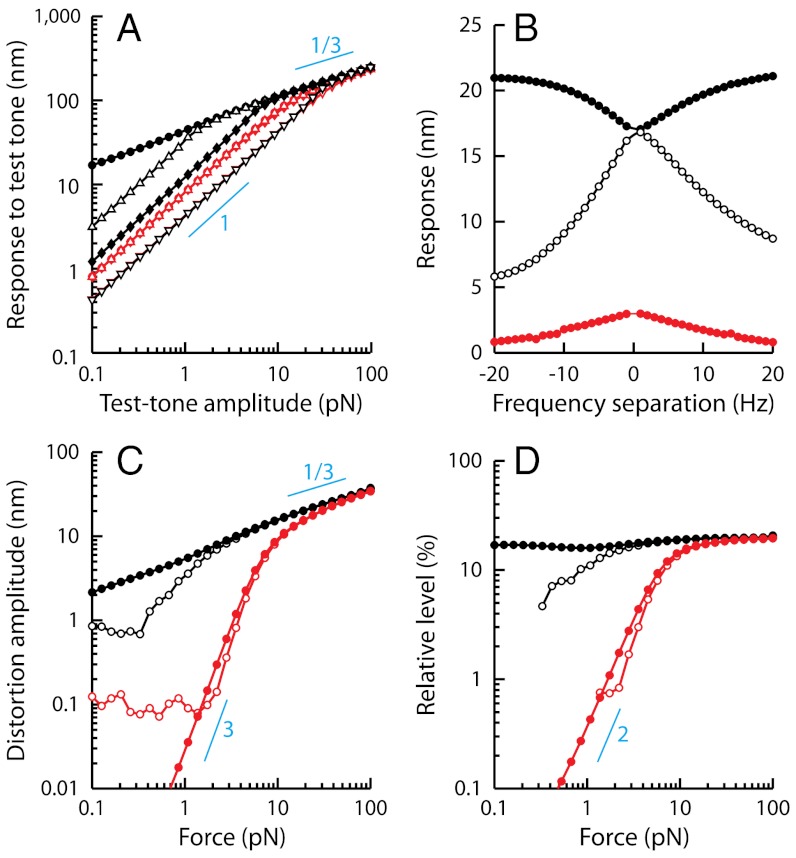
Fig. 7.
Simulations of two-tone interferences by a critical oscillator. (A) Two-tone suppression. The response at the frequency f1 = 20 Hz (black) or f1 = 200 Hz (red) of a test tone is plotted as a function of the amplitude F1 of this component of the two-tone stimulus for various amplitudes F2 (•, 0 pN; △, 1 pN; ⧫, 5 pN; ▿, 25 pN) of a masker tone at f2 = 22 Hz (black) or f2 = 220 Hz (red). The oscillator displayed a characteristic frequency of spontaneous oscillation fC = 20.9 Hz. (B) Here F1 = F2 = 0.2 pN, the test-tone frequency f1 = 21 Hz ≅ fC was fixed while the masker-tone frequency f2 was varied. The responses at frequencies f1 (black disks) and f2 (white disks), as well as the arithmetic-mean level of the cubic difference products at frequencies 2f1 - f2 and 2f2 - f1 (red disks), are plotted as a function of the frequency separation Δf = f2 - f1. (C) Two-tone distortions. The arithmetic-mean level of the cubic difference products is plotted as a function of the stimulus amplitude  at resonance (black; f1 = 20 Hz and f2 = 22 Hz) and off-resonance (red; f1 = 200 Hz and f2 = 220 Hz). (D) The arithmetic-mean level of the two cubic difference products was divided by that of the primaries and plotted as a function of the stimulus amplitude
  . The system was deterministic, except in C and D (open symbols) where the oscillator was subjected to random noise. Thin blue lines represent power laws (power indicated next to the line). Parameter values: μ = 0, b = 1017 m-2·s-1, Λ = 1·10-7 N·s·m-1.

