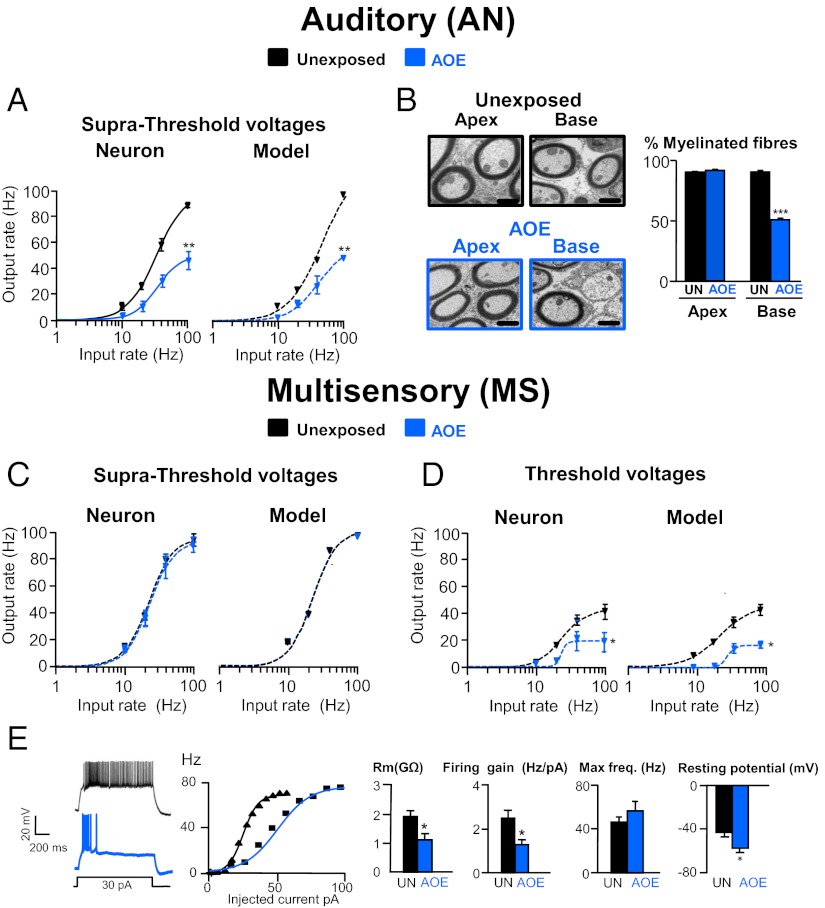
Fig. 2.
AOE modulates FC transfer function upon AN and MS stimulation. (A) AN inputs were stimulated from 10 to 100 Hz. Average input–output relationships (n = 5–6) were obtained in unexposed condition (black) and after AOE (blue). Experimental and model data are represented, and lines are fits to a Hill function as detailed in SI Methods. (B) Transmitted electron micrographs of peripheral AN fibers in control condition (black frame) and after AOE (blue frame) at the base and the apex of the cochlea. Histograms represent the percentage of myelinated AN fibers in those conditions. (Scale bar: 1 μm.) (C and D) MS inputs (n = 5–6) were stimulated, and experimental and model data were fitted as described in A. Firing frequencies were measured at suprathreshold (C) and threshold (D) stimulating voltages. (E) Traces represent the granule cell firing in response to 1-s, 30-pA step current injections in unexposed condition (black) and after AOE (blue). Transfer functions for the two cells are shown. Histograms show that AOE decreases the granule cell membrane resistance and firing gain, leaving the maximal firing frequency unaffected (n = 9–10 per condition). Granule cell resting potentials were more hyperpolarized after AOE. *P < 0.05, **P < 0.01, ***P < 0.001: unpaired t tests.

