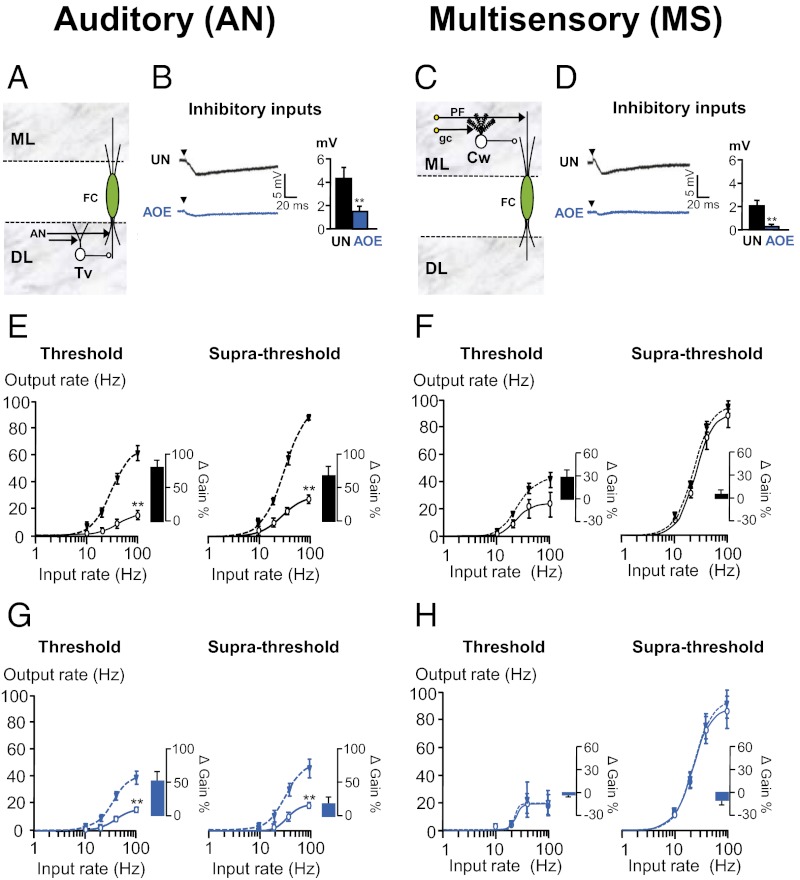
Fig. 3.
FC gain control via inhibitory synaptic transmission is disabled after AOE. (A) AN inputs directly terminate in tuberculo ventral cells (Tv), which inhibit FCs. (B) AN stimulations (25 V, 0.3 Hz) trigger smaller IPSPs after AOE (blue). Membrane potential was −70 mV. (C) MS inputs directly terminate onto cartwheel cells (Cw), which inhibit FCs. (D) MS stimulations (25 V, 0.3 Hz) trigger smaller IPSPs after AOE (blue). Membrane potential was −70 mV. (E–H) Average input–output relationships (n = 5–6) were obtained following AN (E and G) and MS (F and H) stimulations before (solid line) and after (dashed line) removal of synaptic inhibition. (G) Note that inhibitory synaptic transmission has a reduced modulatory effect at threshold which disappears at supra-threshold stimulating voltages. Experimental data are represented in control (E and F) and after AOE (G and H), and lines are fits to a Hill function as detailed in SI Methods. Histograms represent the changes in the gain before and after removal of synaptic inhibition. **P < 0.01: unpaired t tests.

