Fig. 2.
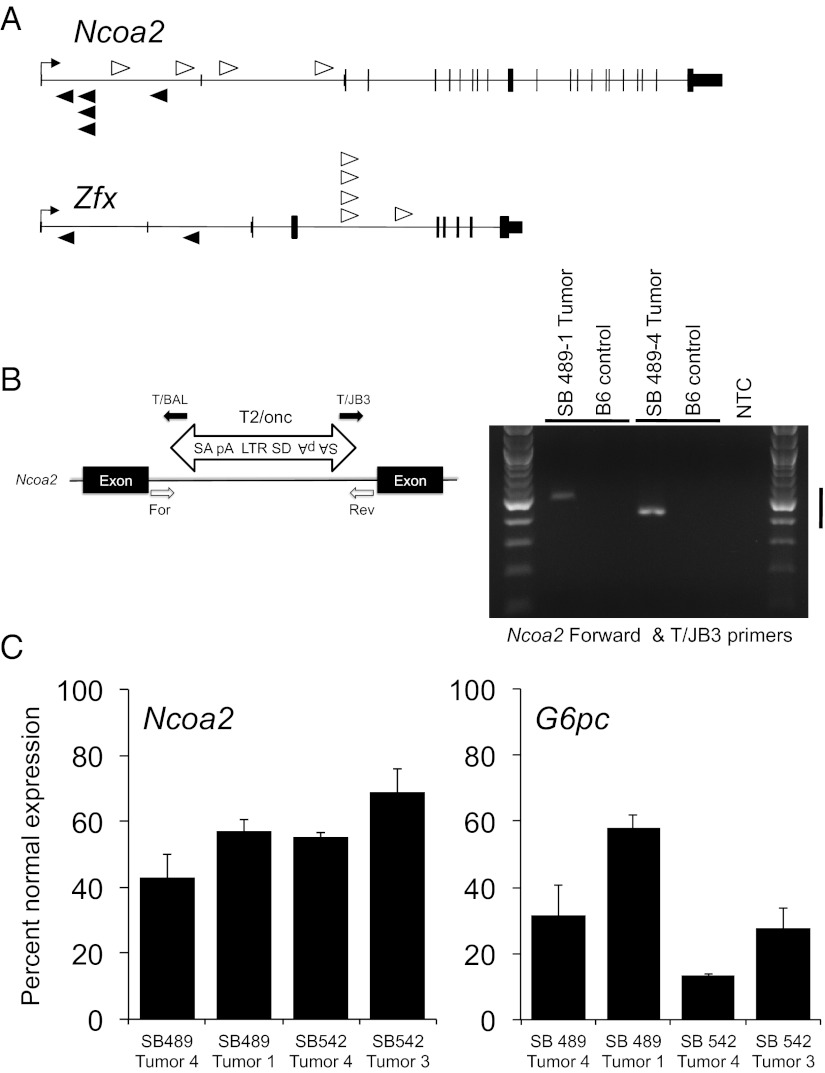
Transposon insertions in Ncoa2 and Zfx associated with accelerated liver tumorigenesis. (A) Schematic representation of SB transposon insertions into Ncoa2 and Zfx. White arrowheads represent T2/Onc insertions in the sense orientation relative to target genes. Black arrowheads represent antisense-oriented insertions. The height of protein-coding exons is taller than the untranslated sequences for each gene. (B) Validation of SB transposon insertions in quadruple-transgenic liver tumors. PCR genotyping was performed using genomic DNA isolated from individual liver tumor nodules. For each insertion, one endogenous primer [forward (For) or reverse (Rev)] and one transposon primer (T/BAL or T/JB3) was used to validate the orientation of the transposon insertion. B6, control C57BL/6 tail gDNA; MSCV 5′LTR, long terminal repeat of the murine stem cell virus; pA, polyadenylation signal; SA, splice acceptor; SD, splice donor. (C) Real-time PCR quantitation of Ncoa2 and G6Pase mRNA expression in four liver tumors normalized to mRNA expression of the surrounding normal liver. Bar graphs represent mean Ncoa2 and G6Pase mRNA levels relative to Actin and 18S rRNA controls, respectively. Error bars represent SDs from three independent measurements.

