Fig. 4.
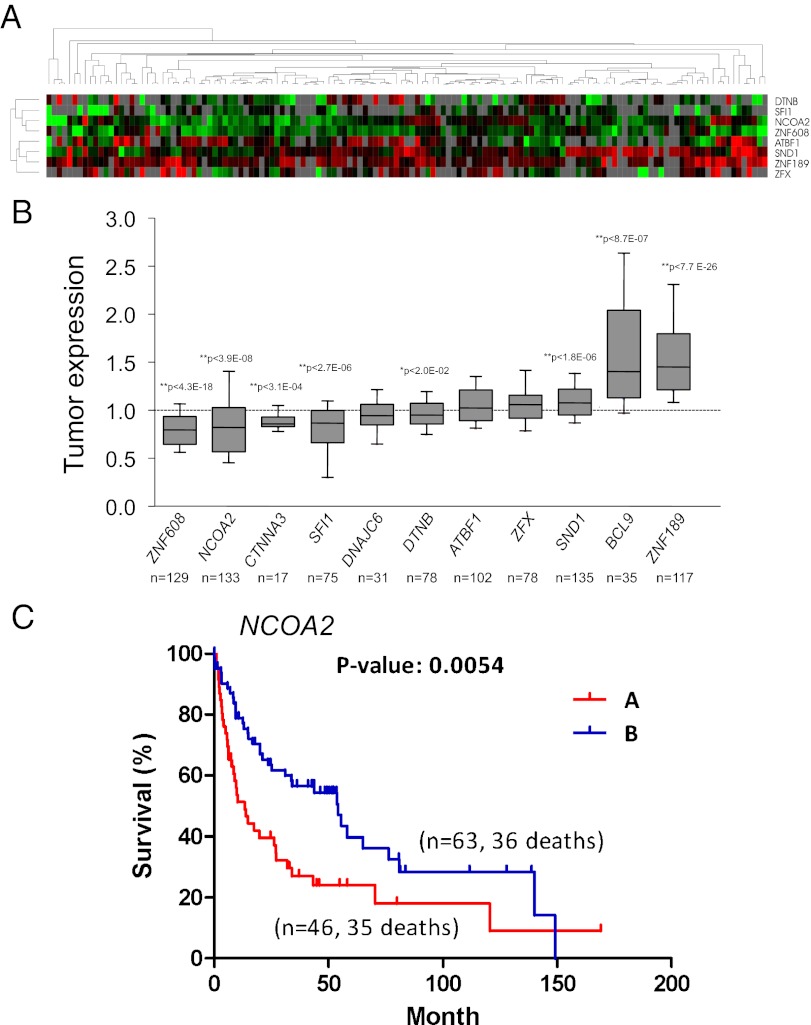
Analysis of CIS candidates in human HCC samples. (A) Hierarchical cluster analysis of gene-expression data from 139 human HCC samples. A dendrogram (Upper) and heat map (Lower) of gene expression data were generated using eight orthologous genes from CIS candidates. Red and green cells reflect high and low expression levels, respectively; gray represents no significant information. (B) Quantification of tumor mRNA expression of CIS candidates relative to normal controls as previously described in Lee et al. (ref. 23). Each box represents the range of expression (25th to 75th percentile) observed. Error bars indicate the 10th and 90th percentiles, and the median is depicted by a horizontal line within the boxes. An independent one-sample t test was used to determine statistical significance. *P < 0.05; **P < 0.01. The P value and number of samples analyzed for each gene is shown. (C) Kaplan–Meier plots of overall survival of individuals with HCC clustered by low NCOA2 expression (cluster A) and higher NCOA2 expression (cluster B). P = 0.0054, log-rank test.

