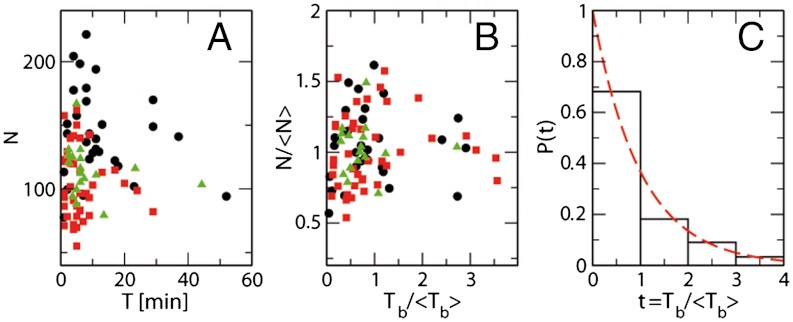
Fig. 4.
Depolymerization of FtsZ rings under different conditions: A shows the (T,N) distribution for the size of each ring N (estimated number of monomers) and its observed survival time T (minutes from the first to the last AFM image in which the ring is observed); black circles, buffer with GMPCPP; red squares, buffer with GTP; green triangles, GTP buffer with 15% glycerol. B shows the distribution ( ,
, ) for the values of N and Tb ≡ NT, normalized to their mean values, given in Table 1. C presents the histogram for the normalized lifetime per bond
  , collecting the data from the three nucleotide buffers in B independently of their size. The red dashed line is P(τ) = exp(-τ), with no fitting parameters, which represents the probability distribution for independent events with unit frequency.

