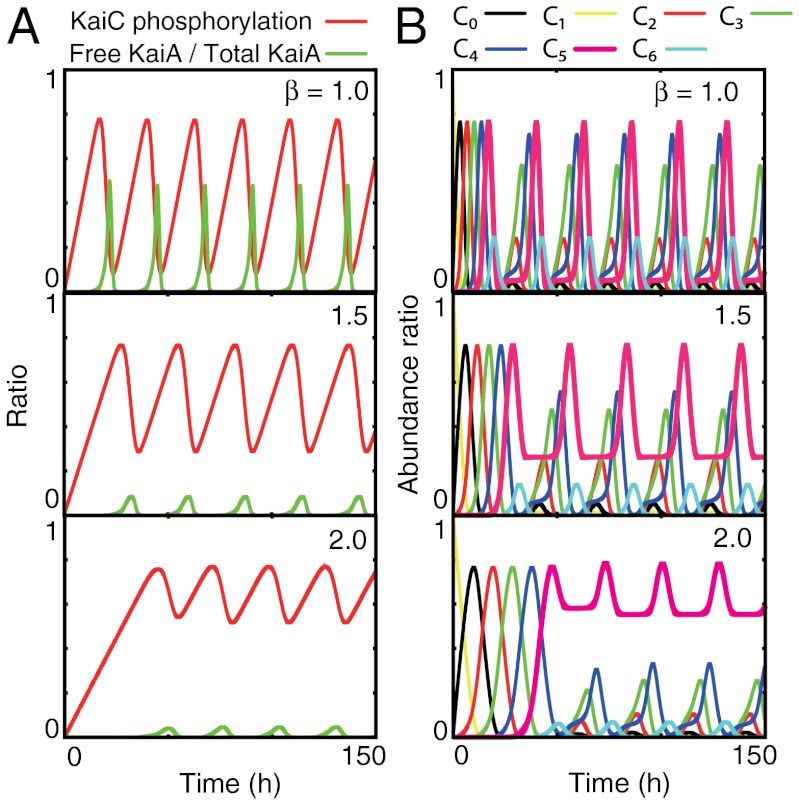
Fig. 2.
Oscillations in KaiC phosphorylation at various temperatures (β = 1.0,1.5,2.0). (A) Red line indicates the time series of the mean phosphorylation level defined by  , whereas the green line indicates that of the fraction of free KaiA, A/Atotal. A decrease in temperature causes a decrease in the amplitude of the phosphorylation level. (B) Time course of the abundance of each form of KaiC, Ci. At low temperature, the basal amount of C5 (magenta line) is remarkably high.

