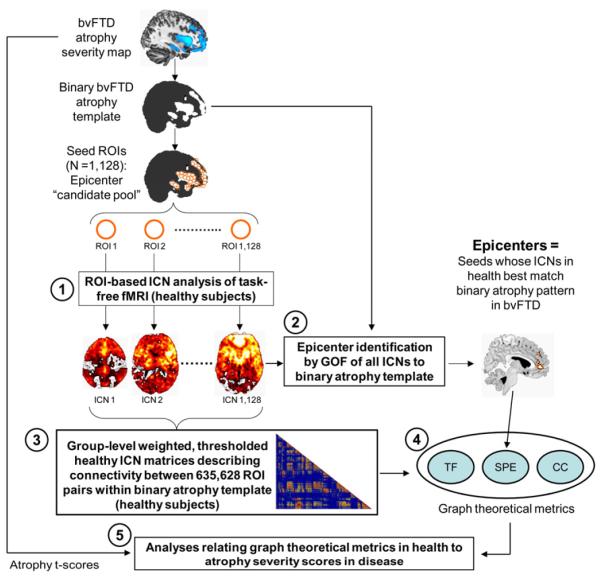
Figure 2. Study design schematic.
Atrophy maps from five neurodegenerative syndromes were delineated in a previous study (Seeley et al., 2009) and binarized to create five sets of 4 mm-radius spherical ROIs representing an epicenter “candidate pool” for each syndrome. Based on these pools, five steps were involved to infer the relationship between healthy intrinsic functional connectivity and atrophy severity in disease: (1) the intrinsic functional connectivity of each ROI was derived with task-free fMRI data from healthy controls, resulting in one whole-brain ICN map for each ROI; (2) regions whose ICNs in health featured significant goodness-of-fit (GOF) to the binarized parent atrophy map were identified as “epicenters” at the group-level; (3) group-level weighted, thresholded healthy ICN matrices were constructed, describing connectivity between all ROI pairs within the binarized atrophy template; (4) three graph theoretical metrics were calculated from the group-level ICN matrices, including shortest functional path to the epicenters (SPE), total flow (TF), and clustering coefficient (CC); (5) correlation and stepwise regression analyses were employed to examine the relationship between the three graph theoretical metrics in health and atrophy t-scores in disease. This process was carried out for each of five syndromic atrophy patterns; for illustration, the steps used for the bvFTD-related analyses are shown here.

