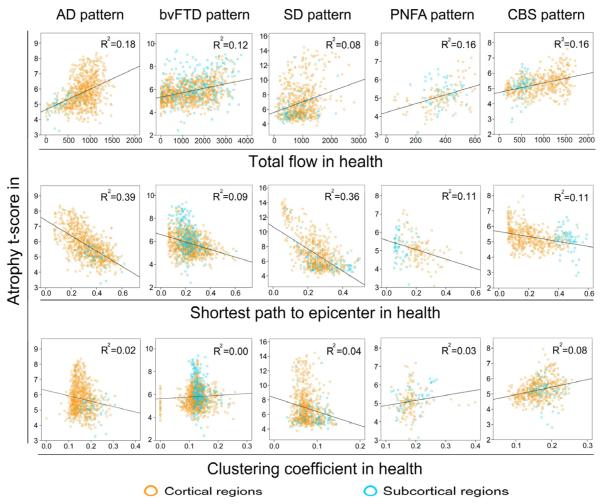
Figure 4. Intra-network graph theoretical connectivity measures in health predict atrophy severity in disease.
Regions with high total connectional flow (Row 1) and shorter functional paths to the epicenters (Row 2) showed significantly greater disease vulnerability (p < 0.05 family-wise-error corrected for multiple comparisons in AD, bvFTD, SD, PNFA, and CBS), whereas inconsistent weaker or non-significant relationships were observed between clustering coefficient and atrophy (Row 3). Cortical regions = blue circles; subcortical regions = orange circles.

