
Figure 3. Gender specific down-regulation of miRNA.
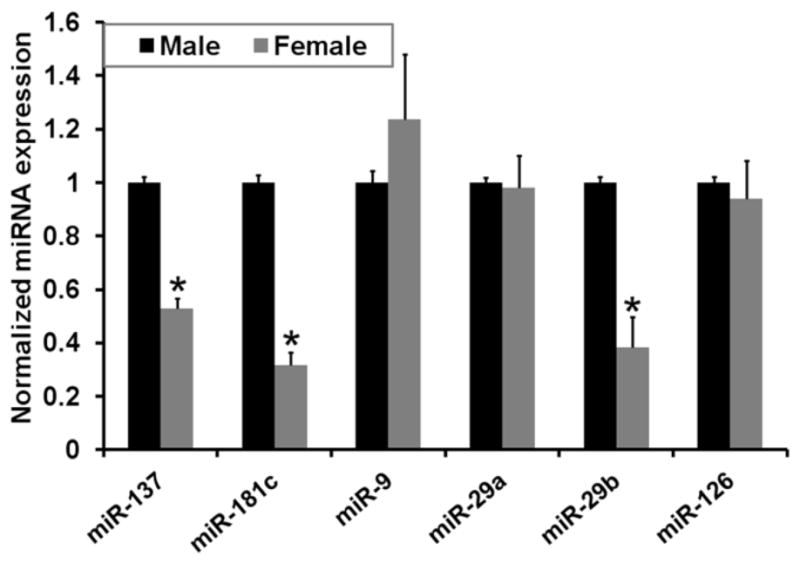
The expression levels of blood serum miR-137 (*, P<0.02), -181c (*, P<0.02), -29a, -29b (*, P<0.05), and -9 in male and female mice (n=6) were measured by qRT-PCR. The expression of miR-126 is shown as a control. Relative expressions shown are normalized to miR-22 and average male (n=6) expressions. The statistical significance between control and AD sera were determined by 2-tailed student t tests.