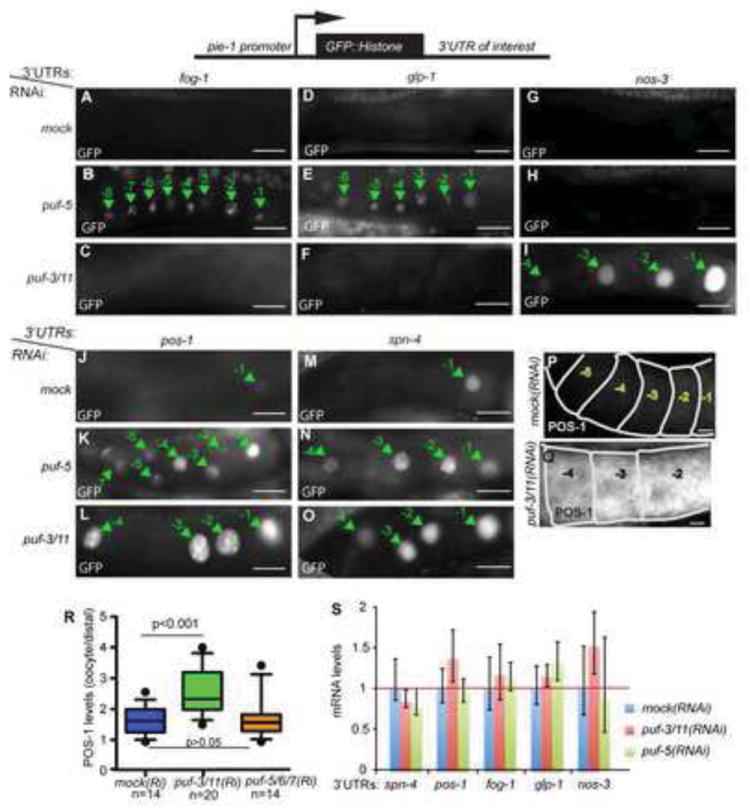
Fig. 2. PUF-3/11 and PUF-5/6/7 repress translation through common and distinct 3’UTRs.

(A-O): Fluorescence micrographs of GFP∷H2B expressed from reporter transgenes under the control of the indicated 3’UTRs are shown for proximal gonad arms of live worms; oocyte nuclei (green arrows) are numbered as in Fig. 1A. Scale bars are 20 μm. Bottom diagram shows summary for RNAi effects on 3’UTR reporters, in which the top row summarizes GFP expression in control worms (white=no expression, grey=mild, black=strong) and bottom rows with colored boxes summarize expression of different reporters after RNAi depletions (at left); green=no change, red=increased expression. (P-Q) POS-1 protein staining after empty vector (mock) RNAi (P) or puf-3/1(RNAi) (Q). (R) Whisker plot (10-90th percentile) quantifying POS-1 fluorescence staining; puf-3/11(RNAi) levels were significantly higher but puf-5;puf-6/7(RNAi) levels were not. (S) mRNA levels were quantified after different RNAi depletions for the indicated 3’UTR reporters by real time quantitative RT-PCR. Each bar represents an average of three replicates. No significant increases in relative mRNA levels of puf-5(RNAi) or puf-3/11(RNAi) compared to mock RNAi were detected for all reporters (p>0.05). The experiment was repeated at least twice with similar results.
