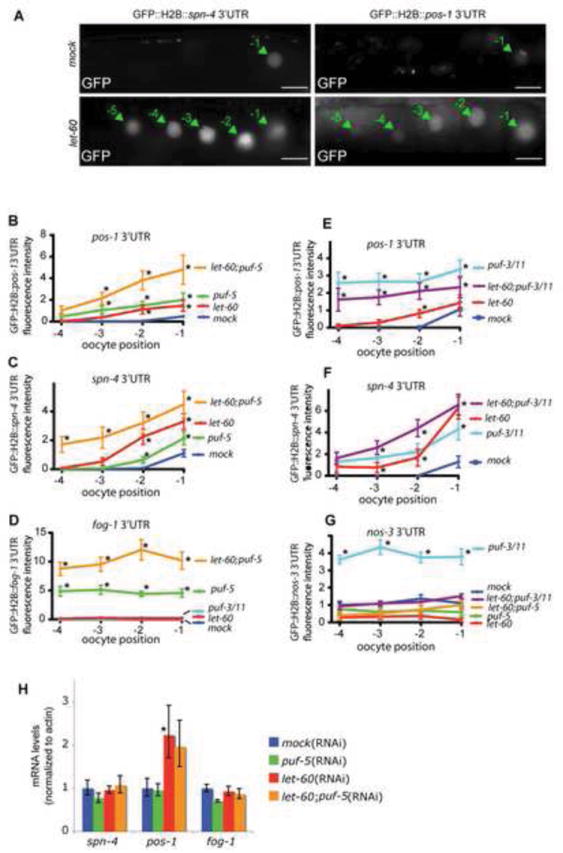
Fig. 4. Ras functions with PUF-5 to repress specific 3’UTRs.

(A) Fluorescence imaging of GFP∷H2B reporters under the control of the indicated 3’UTRs in the proximal gonad of live worms. Green arrows point to oocyte nuclei. Numbers refer to their position as defined in Fig. 1A. Note that, in pos-1 and spn-4 control worms, the GFP is weakly detected in the nucleus of the last oocyte in some gonads. Scale bars are 20 μm. (B-G) Quantification of the let-60/Ras(RNAi) effects on different 3’UTRs. Each graph plots GFP maximum intensity in nuclei against oocyte position for the indicated single or double RNAi conditions for one experiment (n=8-24 gonads for all graphs; Error bars are s.e.m.). Similar results were obtained for at least two independent experiments. *Denotes statistically significant differences (p<0.01-0.001) from empty vector (mock) RNAi controls. (H) Quantification of mRNA levels for the 3’UTR reporters as determined by real time quantitative RT-PCR as in Fig. 2S; pos-1 reporter mRNA levels were significantly increased (*, p<0.01).
