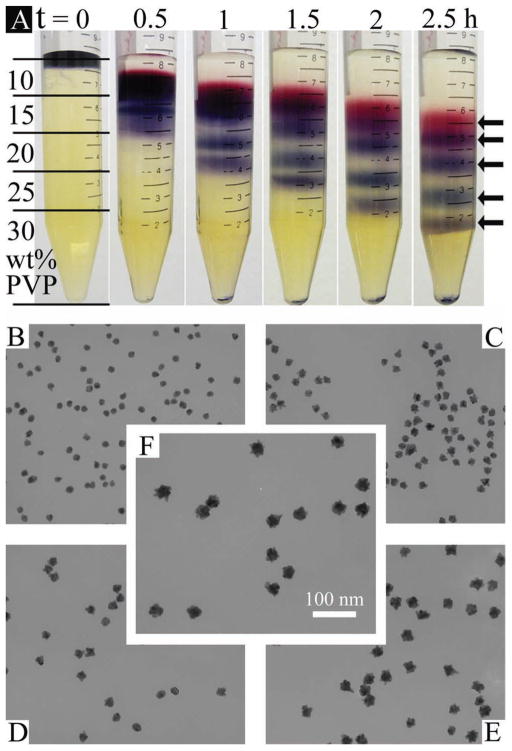
Figure 1.
Separation of 15, 18, 21, 27, and 31 nm five differently sized AuNPs in a PVP 10 000 viscosity gradient. A) Photographs taken at 0.5 h intervals. Gradient thickness is indicated by black lines on the leftmost tube. Five NPs fractions, indicated by arrows, can be seen clearly after 2.5 h of centrifugation. B–F) TEM images, corresponding to fractions from top to bottom, show NPs size in each fraction. Scale bar in (F) is applicable to all images.

