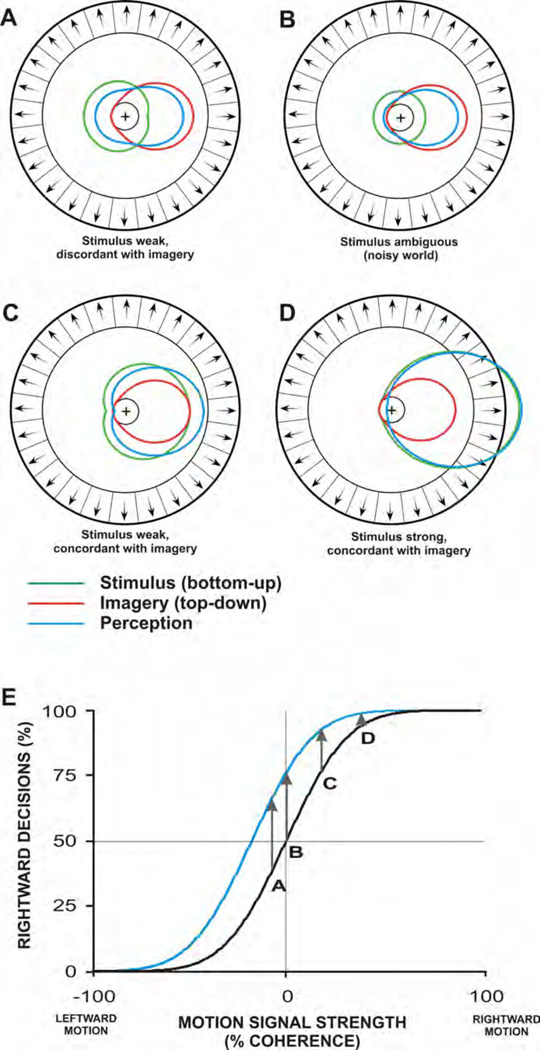
Figure 6.
Conceptual model to account for perceptual consequences of interactions between stimulus and imagery signals in visual cortex. Panels A–D represent hypothesized patterns of activity elicited in area MT by bottom-up signals of different direction and magnitude and a top-down signal of fixed direction and magnitude. Arrowed segments symbolize cortical direction columns (plotted in circle for graphical convenience). Green and red polar plots indicate hypothesized activations of each directional column elicited, respectively, by bottom-up stimulus and top-down imagery signals. Blue curve indicates weighted sum of the two signals (stronger signals have disproportionately large weights). Black circle represents baseline activity of each column.
(A) Stimulus signal (green) corresponds to leftward motion and the activity pattern is modeled as low coherence, high directional variance. Imagery signal (red) corresponds to rightward motion and the activity pattern is modeled as mid-level coherence, low variance. The weighted sum of these discordant activity patterns (blue) exhibits a bias toward the imagery direction (rightward). The ratio of rightward to leftward perceptual reports is predicted to be proportional to the ratio of activities (blue curve) for the corresponding neurons, favoring rightward in this case, despite a leftward stimulus.
(B) Stimulus signal (green) corresponds to directional noise and the activity pattern is modeled as 0% coherence. Imagery signal (red) is same as Panel (A). The weighted sum of these discordant activity patterns (blue) exhibits a bias toward the imagery direction (rightward), despite an incoherent stimulus. The ratio of perceptual reports is predicted to favor rightward in this case, despite an ambiguous stimulus.
(C) Stimulus signal (green) corresponds to rightward motion and the activity pattern is modeled as low coherence, high directional variance. Imagery signal (red) is same as Panel (A). The weighted sum of these activity patterns (blue) reflects the synergy between stimulus and imagery signals. The ratio of perceptual reports in this case is predicted to exhibit a moderate rightward bias above that resulting from stimulus signal alone.
(D) Stimulus signal (green) corresponds to rightward motion and the activity pattern is modeled as high coherence, low directional variance. Imagery signal (red) is same as Panel (A). The weighted sum of these activity patterns (blue) reflects the synergy between stimulus and imagery signals. Because the stimulus is strong and unambiguous, the imagery signal yields an insignificant rightward bias above that resulting from stimulus signal alone.
(E) Plot of expected psychometric functions for right-left direction discrimination. Direction discrimination performance is predicted to be proportional to the relative strengths of activation of neurons in opposing (rightward vs. leftward) direction columns. Stimulus-only condition is indicated in black. Imagery condition, for which rightward motion has been associatively paired with the color red, is indicated in red. The upward shift of the psychometric function reflects the perceived directional bias toward rightward motion in the red condition. The four arrows correspond to the imagery-induced directional biases elicited for conditions A–D above. The bias is large for conditions below threshold (when the stimulus is ambiguous), but the imagery-induced bias is small when the stimulus signal is robust and umbiguous.

