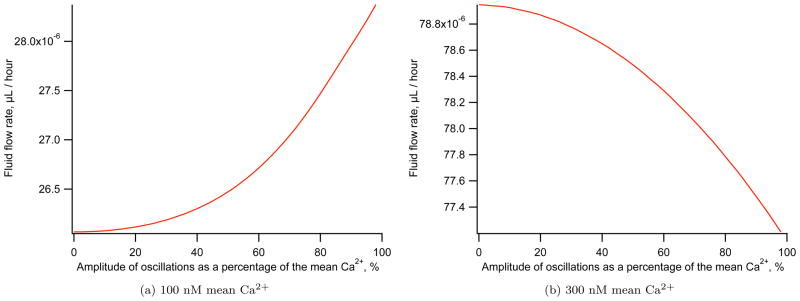
Figure 7.
Fluid flow rate against amplitude of periodic Ca2+ oscillations for two different mean Ca2+ concentrations. The maximum fluid flow rate occurs with large amplitude oscillations for a 100 nM mean Ca2+. With a larger 300 nM mean Ca2+ the maximum secretion occurs with low amplitude oscillations. Both simulations are completed with a 7 s period sine function.

