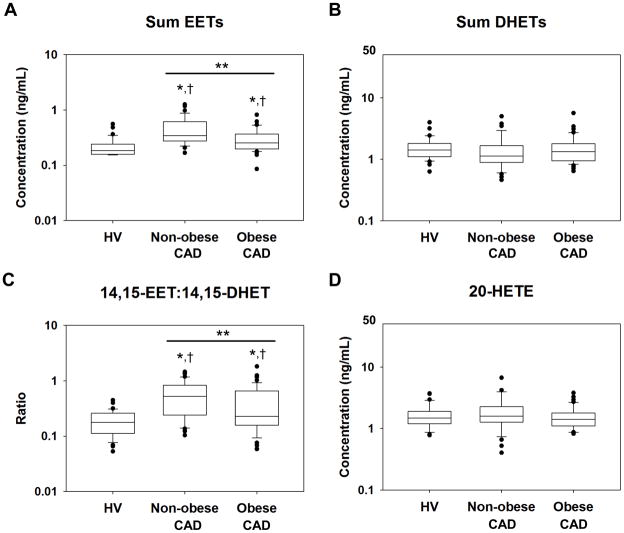
Figure 1.
Distribution of plasma (A) sum EETs, (B) sum DHETs, (C) 14,15-EET:14,15-DHET, and (D) 20-HETE in healthy volunteers (HV, n=36), non-obese CAD patients (n=36), and obese CAD patients (n=46) plotted on a log10-scale. The line within the box defines the median, the ends of the boxes define the 25th and 75th percentiles, the error bars define the 10th and 90th percentiles, and the individual points identify values outside the 10th and 90th percentiles. *Unadjusted P<0.0125 versus HV. †P<0.0125 versus HV after adjusting for age, gender, and race. **P<0.0125 for the obese CAD versus non-obese CAD comparison.

