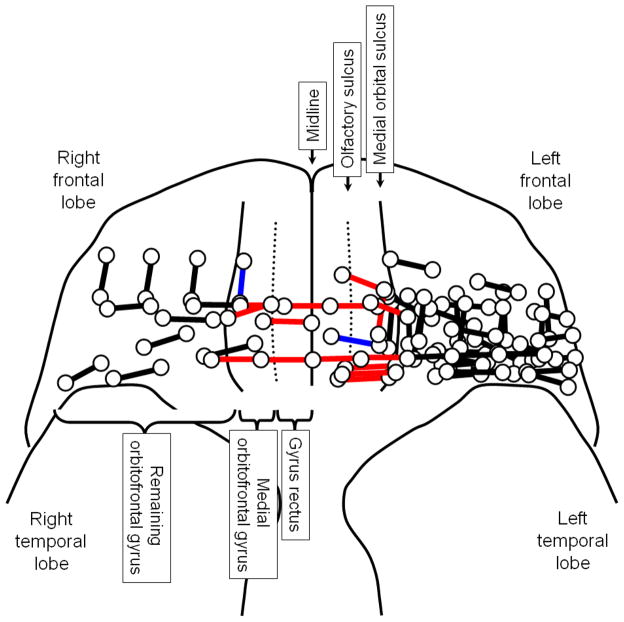
Figure 2. Summary of electrical stimulation mapping.
Circles: electrode sites. Red bars: sites of which stimulation elicited an unpleasant smell. Blue bars: sites of which stimulation elicited a pleasant smell. Black bars: sites of which stimulation failed to elicit an olfactory hallucination. Dotted lines: olfactory sulci where the olfactory tracts lie in. The medial surface of gyrus rectus is not shown. Patient #12 had a single electrode located on the medial surface of gyrus rectus, as presented in Figure 1.

