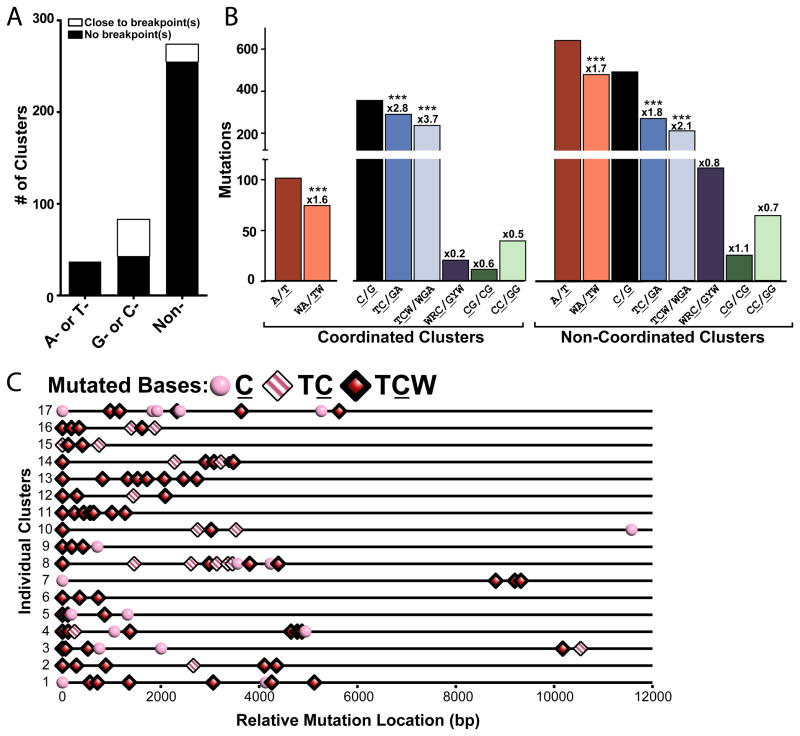
Figure 6.
Mutation Clusters in Sequenced Human Cancers. (A) Mutation clusters in non-SHM regions separated by type of strand-coordination (“A- or T-” coordinated, “G- or C-” coordinated, and “non-” coordinated). White bars indicate the number of clusters co-localized with breakpoint(s). Co-localization was registered when the region covered by the cluster plus left and right flanks of 20,000 nucleotides contained at least one breakpoint. Black bars depict the number of clusters not associated with a specific breakpoint. (B) Number of mutations from the coordination classes in (A) that occurred within specific sequence motifs. Numbers above bars indicate the fold enrichment of clustered mutations occurring at a motif over the frequency of the motif occurs in the chromosomal sequence that the cluster spans (See Cluster Sequence in Table S9). Asterisks demark motifs significantly enriched in mutation clusters (P-value <0.0001) as determined by Chi-square (See also Figures S3). (C) Distribution of mutations within 17 C-coordinated clusters with greater than 3 mutations. Mutated cytosines are categorized by their presence in a TC motif (pink and white striped diamonds), TCW motif (red diamonds), or no identified motif (pink circles).

