Fig. 2.
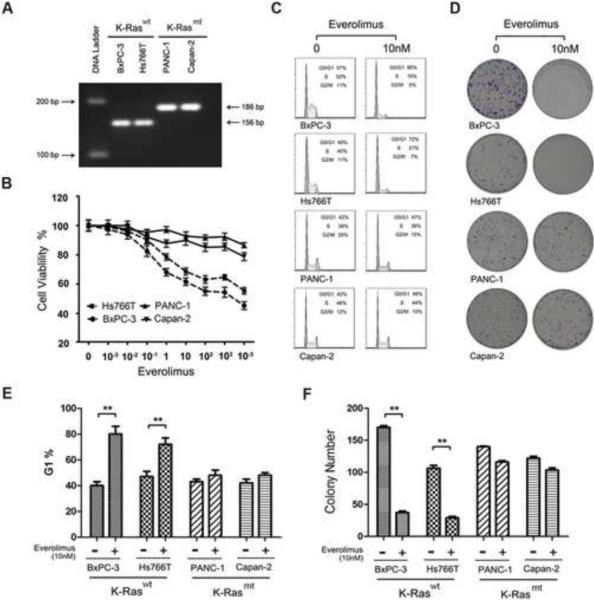
K-Ras mutations in PDAC correlate to rapalog resistance. (A) PCR-RFLP analysis of K-Ras mt and wt in four PDAC cell lines, BxPC-3, Hs766T, PANC-1 and Capan-2. (B) Cell viability assay of the response of the K-Ras wt Hs766T and BxPC-3 and K-Ras mt PANC-1 and Capan-2 cell lines to everolimus treatment. (C) Flow cytometry cell cycle analysis of PDAC cell lines untreated (0nM) or treated with 10nM everolimus. The cells in G/G1, S and G2/M phase were presented in the percentage. (D) Colony formation assay of PDAC cell lines treated or untreated with everolimus, showing the colony densities in the culture wells. (E) The data from flow cytometry as presented in C above were statistically analyzed. The experiment was repeated three times and the percentage of G1 cells was presented as mean ± SD. **, p < 0.01. F. The colony formation data as presented in D above were statistically analyzed. The experiment was repeated three times and the number of colonies was presented as mean ± SD. **, p < 0.01.

