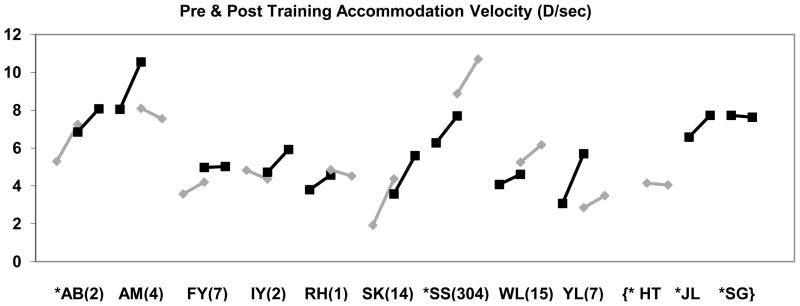
Figure 4.
Comparison of the first and second sessions. Each pair of points joined by a line represents the pre-training accommodation velocity followed by the post-training accommodation velocity for each subject for Double-Step trials (black squares) and Single Step trials (gray diamonds). The data are presented in the order in which the subject performed the experiment with the earliest session on the left. The subject’s initials are below their data and the number in parentheses indicates the number of days between session 1 and session 2. The three subjects on the right side of the plot performed only one of the two paradigms.

