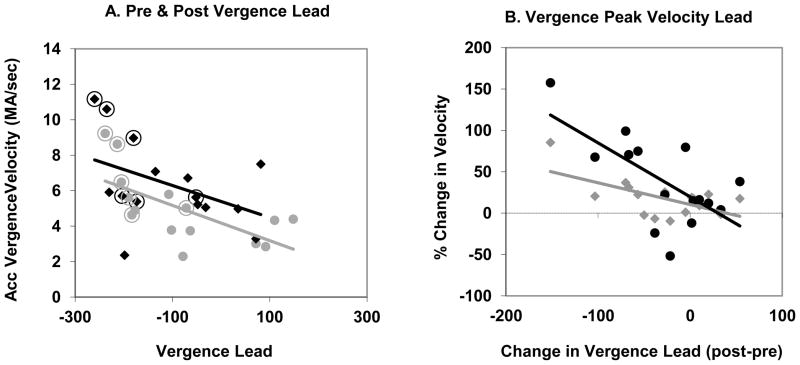
Figure 6.
A. The relationship between vergence lead (time to peak vergence velocity – time to peak accommodation velocity) and peak accommodative vergence velocity pre-training (gray circles) and post-training (black diamonds). Each symbol represents one subject for either the Double-Step or Single-Step session. The data points for the well-experienced subjects are circled. B. The change in accommodation (post-training as a percentage of pre-training; gray diamonds) and accommodative-vergence velocity (black circles) as a function of the change in vergence lead (post-training – pre-training).

