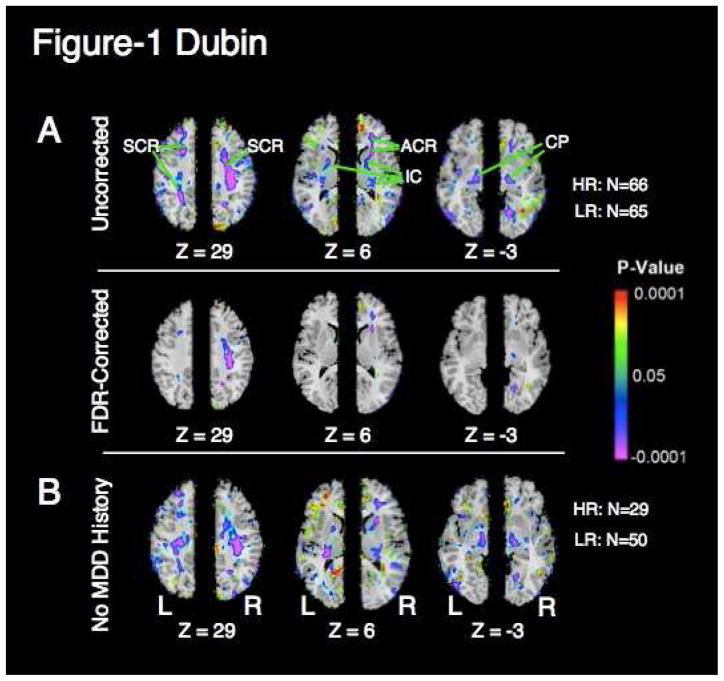
Figure 1. Correlation of white matter volume and risk status.
a. Maps of regional cerebral volume difference (VPW) between high- and low-risk groups. VPW is rescaled for the age and sex of all participants. Colors indicate voxels in which volume differences were significant (P < .05). Warm colors (yellow, orange, and red) represent greater local volume (hyperplasia) in the high-risk group; cooler colors (blue and purple) represent lesser local volume (hypoplasia) in that group. The color bar indicates the color-coding of p-values for testing of statistical significance at each voxel throughout the brain volume. In the upper row, p-values are thresholded at p < .05 without correction for multiple comparisons. In the lower row, p-values are thresholded to control the false discovery rate (FDR) to 10% to correct for multiple comparisons. Risk correlates with white matter hypoplasia in the frontal and parietal lobes bilaterally. Three axial levels (Talairach Z=29, Z=6, and Z=−3) are shown. Volumes of white matter in the frontal and parietal lobes and cerebral peduncle are reduced in the high-risk group, suggesting that white matter hypoplasia in this region is an endophenotype of risk of MDD. SCR, superior corona radiata; ACR, anterior corona radiata; IC, internal capsule; CP, cerebral peduncle; HR, high-risk; LR, low-risk; Z, talairach z coordinate.
b. Maps of group differences in regional cerebral volume (VPW) between high and low-risk groups in which no member had a lifetime history of MDD. Risk correlates with white matter hypoplasia in the frontal and parietal lobes bilaterally, independent of MDD history. Format as in (a).

