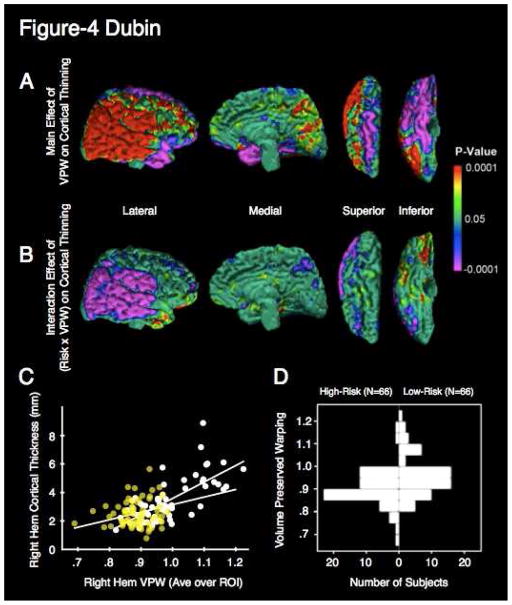
Figure 4. Correlation of white matter volume with cortical thickness.
a. Main effect of average VPW in the right hemispheric region of significance on cortical thinning in the right hemisphere. Cortical thickness throughout the posterior lateral convexity of the right hemisphere correlates positively with average VPW. The inverse correlation is observed in the superior and basal surfaces of the right frontal lobe and the basal surface of the right temporal lobe. The two endophenotypes are interdependent. Colors indicate significant (P < .05) main effect of VPW averaged over the RH region of significance on point-wise cortical thickness of the right hemispheric surface. Lateral, medial, superior, and inferior views with the overlaid cytoarchitectonic map are shown. Areas in red indicate a significant positive correlation between cortical thickness and average VPW, such that cortical thinning co-occurs in direct proportion to the degree of white matter hypoplasia. Effects in the right hemisphere are shown, as these are the most pronounced. Regression is corrected for age and sex.
b. Interaction effect of Risk X VPW. Regions in purple indicate significant (P < .05) interaction effects of risk and VPW on cortical thickness. Risk group interacts with VPW in its effect on cortical thinning over most of the posterior lateral convexity in a distribution overlapping with the main effect of VPW. The relationship between VPW and cortical thickness is influenced by risk status. Regression is corrected for age and gender.
c. Scatterplot of age- and sex-adjusted cortical thickness and right hemisphere average VPW for a representative point at the temporoparietal junction. Regression lines for both the low-risk group (white points) and high-risk group (yellow points) are indicated. The mean cortical thickness is lower in the high-risk group and the slope of cortical thickness vs. VPW is flatter in the high-risk group. The decreased variance of the high-risk group produces the latter effect, which, in turn, produces the interaction effect. Values were taken from a point having both a main effect and interaction effect. This point is indicated by the white dot in (a) and (b) on the right superior temporal lobe.
d. Back to back histogram of average VPW by risk group. The distribution of the high-risk group is significantly more unimodal and kurtotic compared with the distribution for the low-risk group, with or without the higher mode removed. High-Risk participants (N=66) are represented on the left and low-risk participants on the right. The low-risk histogram differs from the high-risk histogram in that it is bimodal, a quality that may reflect greater phenotypic heterogeneity.

