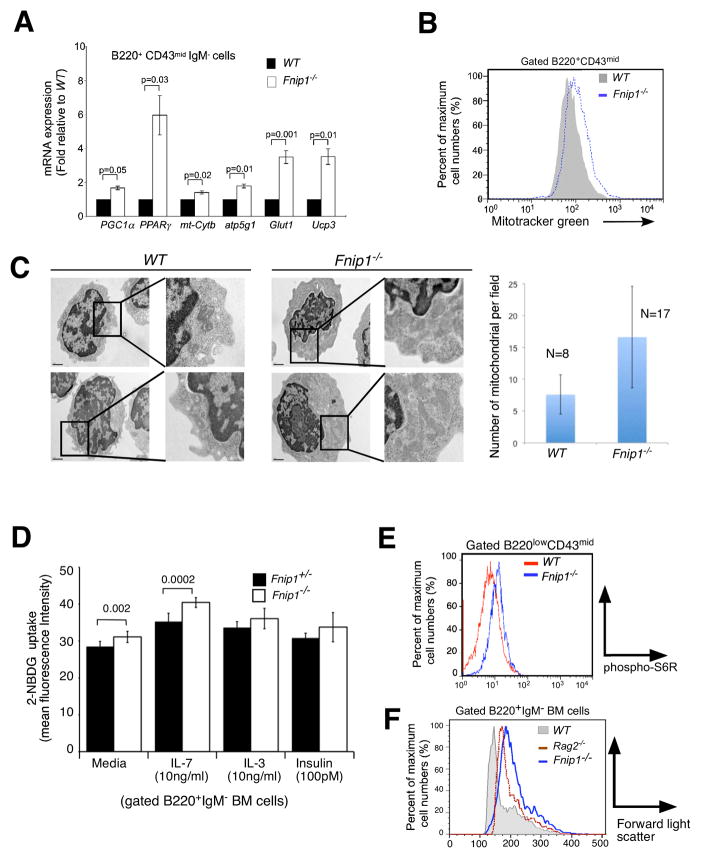
Figure 4. Loss of Fnip1 results in metabolic dysregulation in pre-B cells defined by increased expression of AMPK and mTOR regulated genes, increased mitochondrial biogenesis, and increased mTOR-mediated cell growth.
(A) Purified pre-B cell cDNA from Fnip1−/− and WT mice were subjected to real-time PCR specific for the indicated genes. Bars = means ± SEM of 3 mice/group. P-values are shown. (B) Increased mitochondria in Fnip1−/− pre-B cells. Fnip1−/− and WT BM cells were stained with α-B220, α-CD43 plus the mitochondrial dye MitoTracker® green. Shown is a representative flow cytometric histogram (n=3 mice/group) of gated B220+CD43+ cells. (C) Transmission electron micrographs were obtained on FACS-sorted pre-B cells from 3 WT and 3 Fnip1−/− mice. (left) Shown are representative high-power images (20,000X). (Right) The number of mitochondria per field were enumerated in the cytoplasmic compartment for 8 WT and 17 Fnip1−/− pre-B cells. Bars = means ± SEM. p<0.00006. (D) Increased glucose uptake in Fnip1−/− pre-B cells. Total BM cells were cultured in media, IL-7, IL-3, or insulin at the indicated concentrations for 48 hrs. 2-NDBG was added for the last 3 hrs. Shown is bar graph (n=3 per group for IL-7, n=2 per group in triplicate for IL-3, insulin) showing the relative fluorescence intensity of B220+IgM− gated cells as assessed by flow cytometry. Error bars= mean+/−SEM. P-values are shown. (F) Fnip1−/− and WT BM cells were stained with α-B220, α-CD43, and intracellular pS6R. (G) Shown is a representative forward-light scatter (FSC) histogram overlay comparing the size of gated B220+IgM− pro-B and pre-B cells from WT, Rag2−/−, and Fnip1−/− mice. (see also Figure S4)

