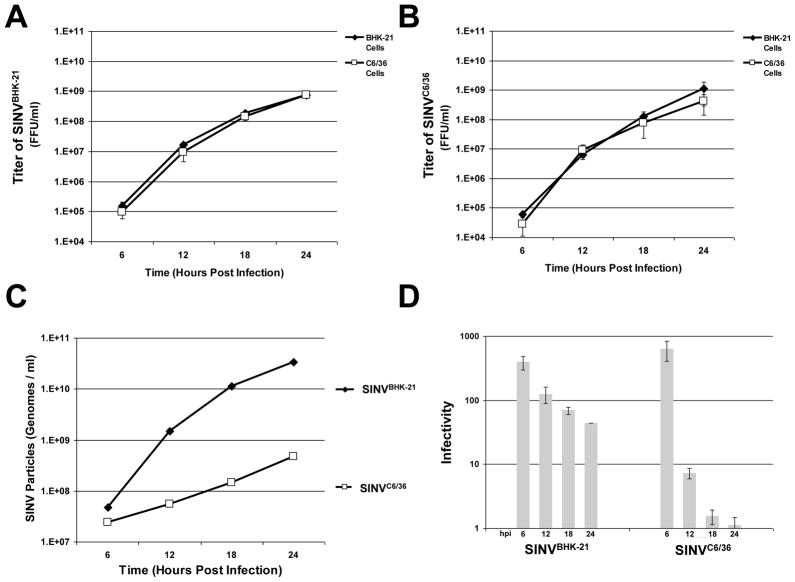
Figure 3. SINV Particle Production is Different Between Mammalian and Mosquito Cells.
A) BHK-21 cells were infected with SINV at an MOI=3 and viral growth kinetics were observed at 6 hour intervals for 24 hours following infection. Values plotted are the titer of SINVBHK-21 observed at each time point when assayed on BHK-21 or C6/36 cells. Values plotted are the averages of a minimum of two biological replicates, with error bars representing the standard deviation of four independent measurements. B) Identical to panel A, with the exception that SINV was produced in C6/36 cells (SINVC6/36) instead of BHK-21 cells. C) Graphical representation of the number of SINVBHK-21 and SINVC6/36 particles produced during infection at the indicated time points. qRT-PCR was used to determine genome copies per ml. D) A bar graph illustrating the infectivity of SINVBHK-21 and SINVC6/36 over time. Values are the averages observed on both BHK-21 and C6/36 cells, with error bars representing the standard deviation.

