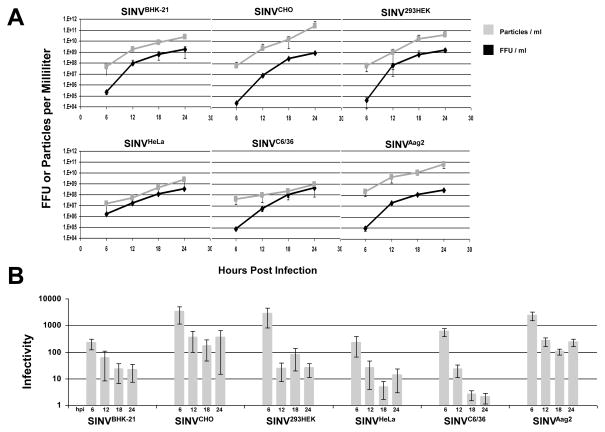
Figure 4. SINV Infectivity Increases as Infection Progresses.
A) SINV virus was derived from different cell lines and graphs representing the number of SINV particles and infectious particles produced observed over time. B) Graphical representation of the SINV infectivity as observed in BHK-21 cells. Values plotted are the averages of two biological replicates, with error bars representing the standard deviation as determined by variable bootstrapping of four independent measurements of two independent preps.

