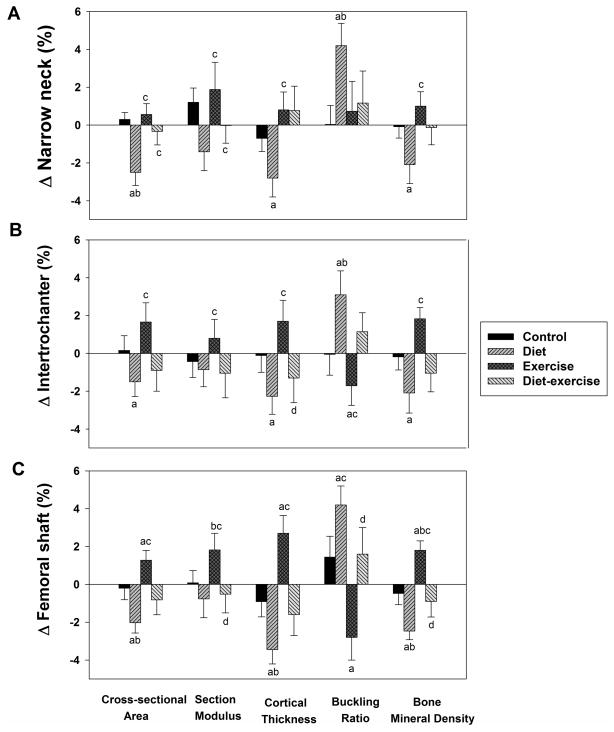
Figure 2.
Changes from baseline in parameters of hip geometry in obese older adults during the 1-year interventions. Values are given as mean ± SE. aP<0.05 for the comparison of the value to baseline, as calculated using mixed-model repeated measures analyses of variance. bP<0.05 for the comparison of the value to control group, cP<0.05 for the comparison of the value to diet group, dP<0.05 for the comparison of the value to exercise group, each calculated using mixed-model repeated measures analyses of variance contrasts.

