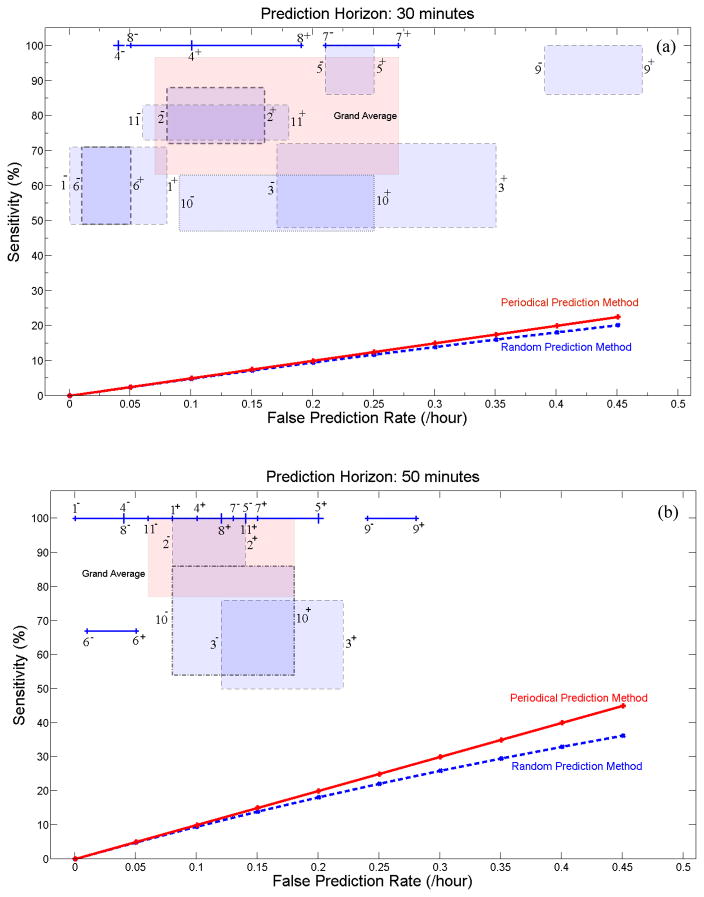
Fig. 7.
Sensitivity versus false prediction rate for each patient (as indicated by patient number seen in Table 1) and for the grand average across patients (labeled in pink as Grand Average) for the seizure occurrence period of (a) 30 and (b) 50 min and SPH=10sec. For each patient, the box or line shows the range of variation of sensitivity versus false prediction rate when different randomly selected reference windows are used. Plus and minus signs used with the patients’ number denote the upper and lower bounds of the corresponding ranges of variation. The performances of the random and periodical prediction methods show values much lower than those found using our system.

