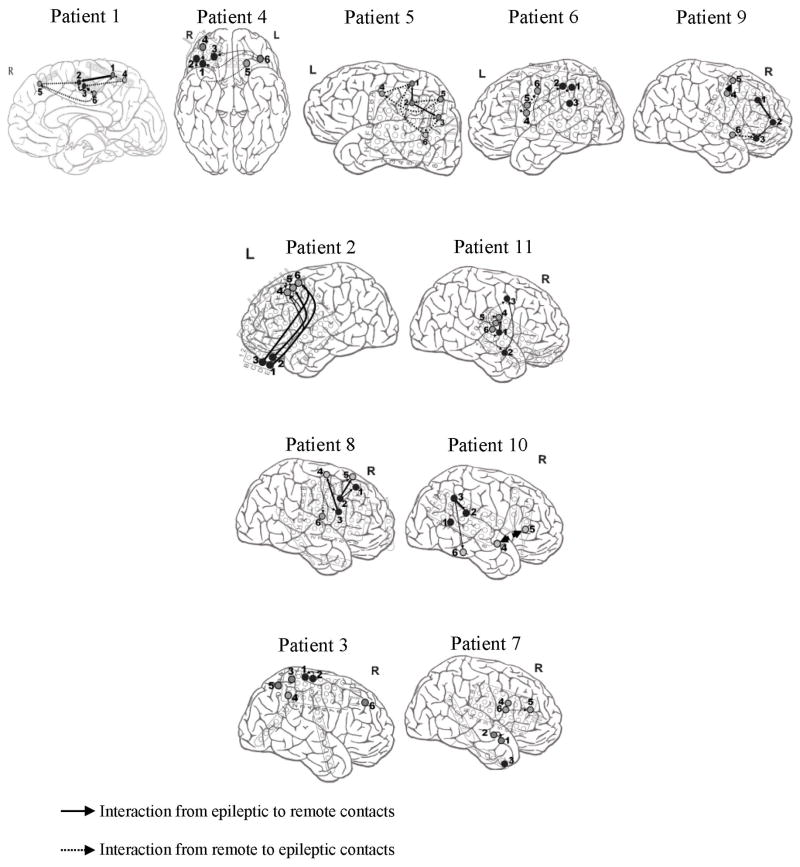
Fig. 8.
Connectivity maps characterizing the preictal strength of synchronization and the direction of interaction. The thickness of the arrows reflects the strength of interactions. For the sake of simplicity, we projected all the contacts on the same cross-sectional view. In these maps, numbers 1–3 and 4–6 refer to the electrodes implanted in the epileptogenic zone and remote areas, respectively.

