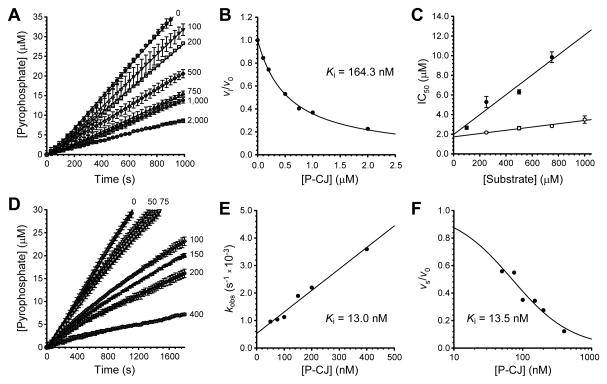
Figure 6. Kinetic characterization of the CJ-15,801-based inhibition of PPCS.
(A) Progress curves analysis for the inhibition of EcPPCS in the presence of increasing concentrations of P-CJ (13), indicated in nM next to each curve.
(B) Plot of the fractional activity (initial velocity vi relative to the inhibited velocity v0), as determined from the progress curves in (a), against inhibitor concentration. The indicated Ki value is determined by fitting the data to the Morrison and Cheng-Prusoff equation.
(C) Determination of the inhibition modality of EcPPCS by P-CJ (13) by calculation of the IC50 values in the presence of increasing concentrations of P-Pan (6) (●), and CTP (○).
(D) Progress curves analysis for the inhibition of SaCoaBC in the presence of increasing concentrations of P-CJ (13), indicated in nM next to each curve.
(E) Plot of the first order rate of inactivation constants (kobs), as determined from the data presented in (D), against inhibitor concentration. The indicated Ki value is determined by fitting the data to the equation for a straight line.
(F) Plot of the fractional activity (steady state velocity vs relative to the inhibited velocity v0), as determined from the progress curves in (D), against inhibitor concentration. The indicated Ki value is determined by fitting the data to a Langmuir isotherm.
All progress curve analyses were performed in triplicate (error bars represent the SD). See Supplemental Experimental Procedures for details on calculations, as well as Figure S2 for the determination of EcPPCS and SaCoaBC kinetic parameters.

