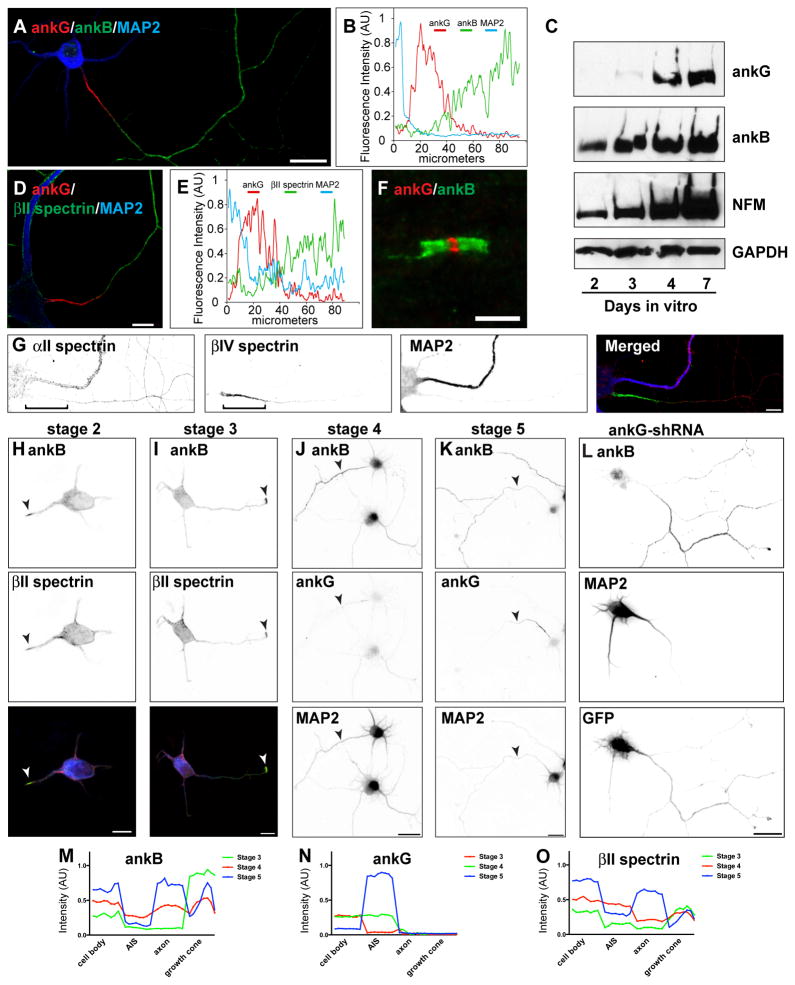
Figure 2. AnkB, αII spectrin, and βII spectrin comprise a distal submembranous cytoskeleton assembled before ankG clustering.
(A) Immunostaining of a 10 DIV hippocampal neuron for MAP2 (blue), ankG (red), and ankB (green). Scale bar, 20 μm.
(B) Line-scan of fluorescence intensity along the axon shown in (A).
(C) Immunoblot analysis of cultured hippocampal neurons. Immunoblotting was performed for ankG, ankB, Neurofilament M (NFM), and GAPDH as a loading control.
(D) Immunostaining of a 10 DIV hippocampal neuron labeled for MAP2 (blue), ankG (red), and βII spectrin (green). Scale bar, 10 μm.
(E) Line-scan of fluorescence intensity along the axon shown in (D).
(F) Node of Ranvier immunostained for ankG (red) and ankB (green). Scale bar, 5 μm.
(G) Immunostaining of a 10 DIV hippocampal neuron labeled for αII spectrin (red), βIV spectrin (green), and MAP2 (blue). Scale bar, 10 μm.
(H–I) AnkB (green) and βII spectrin (red) are enriched at the tips of newly specified axons (arrowheads). In the merged image, MAP2 is shown in blue. Scale bar, 10 μm.
(J–K) Immunostaining for ankB, ankG, and MAP2. Arrowheads indicate axons. Scale bar, 20 μm.
(L) Cultured hippocampal infected with ankG-shRNA adenovirus at DIV 0, and analyzed at 7 DIV. AnkB is enriched in axons lacking ankG. Scale bar, 20 μm.
(M–O) Fluorescence intensity measurements for ankB, ankG, and βII spectrin taken from the soma, AIS, axon, and growth cone.

