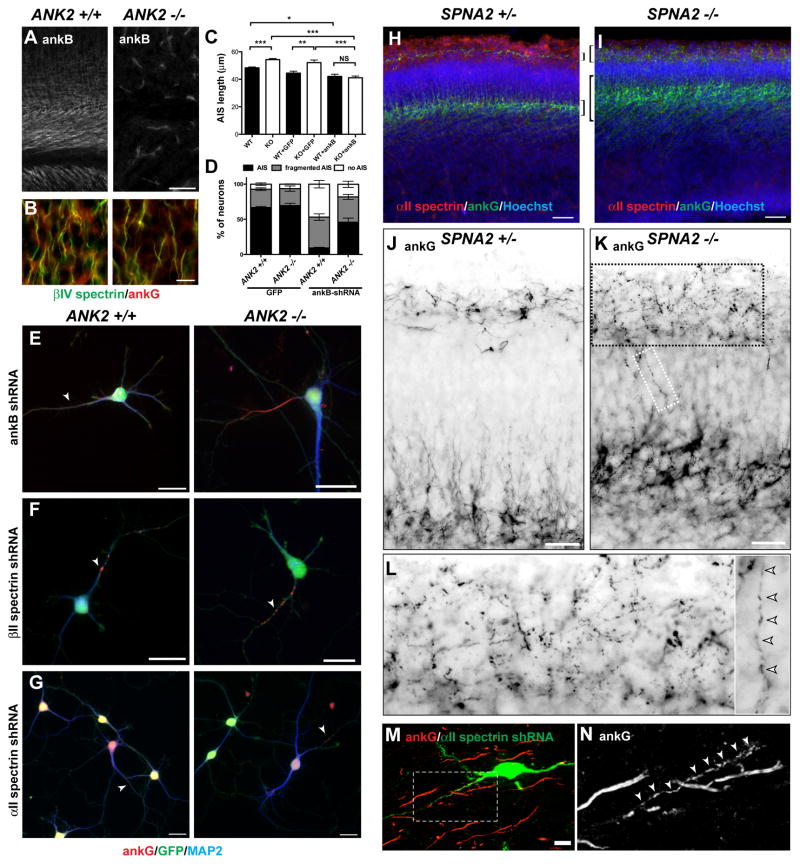
Figure 6. Analysis of ankB-deficient (ANK2 −/−) and αII spectrin-deficient (SPNA2 −/−) mice.
(A) AnkB immunostaining of ANK2 +/+ and ANK2 −/− mice. Scale bar, 25 μm.
(B) βIV spectrin (green) and ankG (red) immunostaining of ANK2 +/+ and ANK2 −/− cortex. Scale bar, 10 μm.
(C) AIS length at 7 DIV from ANK2 +/+ and ANK2 −/− neurons in vitro untransfected, or transfected with GFP or ankB-GFP. Error bars indicate ±SEM. *** P < 0.0001; ** P < 0.001; * P < 0.01; NS, not significant.
(D) The percentage of ANK2 +/+ and ANK2 −/− neurons with a normal, fragmented, or no AIS after viral transduction to express GFP or ankB shRNA. Error bars indicate ±SEM.
(E–G) Immunostaining of hippocampal neurons from ANK2 +/+ and ANK2 −/− mice after silencing of ankB (E), βII spectrin (F), or αII spectrin (G). All neurons shown were transduced and GFP+. Arrows indicate fragmented AIS. Scale bars, 20 μm.
(H–I) E15 cortex from SPNA2 +/− (H) and SPNA2 −/− (I) mice immunostained for αII spectrin (red), ankG (green), and Hoechst (blue). Brackets indicate cortical layers with high levels of ankG immunoreactivity. Scale bars, 50 μm.
(J–K) E15 cortex from SPNA2 +/− (J) and SPNA2 −/− (K) mice immunostained for ankG (green). The regions shown span the two main layers labeled by ankG as shown in panels (H–I).. Scale bars, 25 μm.
(L) Higher magnification images from boxed regions in panel (K) show fragmented ankG immunoreactivity (arrowheads).
(M) αII spectrin shRNA-electroporated neurons at P28 labeled for GFP (green) and ankG (red). Scale bar, 10 μm.
(N) Boxed region from (M) showing fragmented ankG immunoreactivity.

